Last10K.com

Newmarket Corp (NEU) SEC Filing 10-K Annual report for the fiscal year ending Thursday, December 31, 2015

Newmarket Corp

CIK: 879407 Ticker: NEU
EXHIBIT 99.1

NewMarket Corporation Reports Fourth Quarter and Full Year 2015 Results
NewMarket Posts Fourth Quarter EPS of $4.50, Up 7.9%, and Full Year EPS of $19.45 Up 5.8%
Petroleum Additives Fourth Quarter Operating Profit of $75.3 Million, Down 11.9%, and Full Year Operating Profit of $374.9 Million, Down 2.6%
Continuing Investment in R&D and Capital Spending to Fuel Long-Term Growth
501,261 Shares Repurchased in 2015
Richmond, VA, February 1, 2016 – NewMarket Corporation (NYSE:NEU) Chairman and Chief Executive Officer, Thomas E. Gottwald, released the following earnings report of the Company’s operations for the fourth quarter and full year 2015.
Net income for the fourth quarter of 2015 was $53.9 million, or $4.50 per share, compared to net income of $52.1 million, or $4.17 per share, for the fourth quarter of 2014. Net income for 2015 was $238.6 million, or $19.45 per share, compared to net income of $233.3 million, or $18.38 per share, for 2014. Net income for all periods included the impact of valuing an interest rate swap at fair value. Excluding this item, fourth quarter 2015 earnings were $53.2 million, or $4.44 per share, compared to $53.7 million, or $4.30 per share, last year. On the same basis, earnings for the year 2015 were $240.6 million, or $19.61 per share, compared to $237.6 million, or $18.72 per share, last year (see Summary of Earnings table below).
Sales for the petroleum additives segment for the fourth quarter of 2015 were $476.7 million, down 13.0% versus the same period last year, due to lower shipments, foreign currency exchange and changes in selling prices and mix. Petroleum additives operating profit for the fourth quarter of 2015 was $75.3 million, an 11.9% decrease over fourth quarter operating profit last year of $85.5 million. The decrease was due to lower sales volume, changes in foreign currency exchange and increases in research and development investments, partially offset by lower raw material costs.
For the year, petroleum additives sales were $2,125 million compared to sales in 2014 of $2,325 million, a decrease of 8.6%. This decrease was primarily due to foreign currency exchange, changes in selling prices and mix. Operating profit for petroleum additives for 2015 declined 2.6% to $374.9 million, compared to $385.1 million for 2014. Changes in foreign currency overshadowed strong operating performance in the Americas and, to a lesser extent, the Asia Pacific region. The decrease in operating profit was also due to increases in research and development investments and lower sales volume, partially offset by lower raw material costs.
Petroleum additives shipments for the fourth quarter of 2015 were down 4.3% from the same period last year. This decline, which represents the lowest level of quarterly shipments in three years, was primarily due to decreases in lubricant and fuel additives shipments in North America. For the year, shipments declined 1.2% versus 2014, with increases in fuel additives shipments, primarily in North America, offset by declines in lubricant additives in all regions except Latin America. Shipments were below our expectations for both the quarter and full year periods, as demand for lubricant products trended lower in the face of a continued general weakness in the global economy. In addition, we believe the rapid decline in crude oil prices in the fourth quarter may have led some customers to reduce stock levels in anticipation of lower base oil prices.
The effective income tax rate for the fourth quarter of 2015 was 20.3%, down from the rate of 28.8% in the same period last year. The effective rate for 2015 was 29.6%, down slightly from the rate in 2014 of 31.2%. The rate in the fourth quarter of 2015 was lower primarily due to decreases in tax rates for certain of our foreign subsidiaries and an increase in tax benefits associated with our research and development activities in the US and Europe. The research and development tax credit in the US was passed during the fourth quarter of 2015, retroactive to the beginning of the year.
Our business continues to generate strong cash flows. During the year, we paid dividends of $70.8 million, funded capital expenditures of $126.5 million and repurchased 501,261 shares of our common stock for a total of $197.9 million, including 44,778 shares in the fourth quarter. At the end of 2015, we had $482.8 million remaining on our stock repurchase authorization.
Construction continues on our new manufacturing facility in Singapore. We expect commercial production to begin by mid-year 2016. In August, we announced the second phase of construction which will include additional component production units. Phase two will more than double our investment in the Singapore facility and is scheduled to be completed in 2017.
Our stated goal is to provide a 10% return per year for our shareholders over any five year period (defined by EPS growth plus dividends). We may not necessarily achieve a 10% return each year, and 2015 was such a year. Unfavorable exchange rates and softer industry demand have worked against us at a time when we have a great need to invest in developing products to meet new, upcoming specifications and pursue specific growth opportunities. Our increased investments in 2015, evidenced by our more than $125 million of capital expenditures and 14% higher spending in research and development, reinforces that we


The following information was filed by Newmarket Corp (NEU) on Monday, February 1, 2016 as an 8K 2.02 statement, which is an earnings press release pertaining to results of operations and financial condition. It may be helpful to assess the quality of management by comparing the information in the press release to the information in the accompanying 10-K Annual Report statement of earnings and operation as management may choose to highlight particular information in the press release.
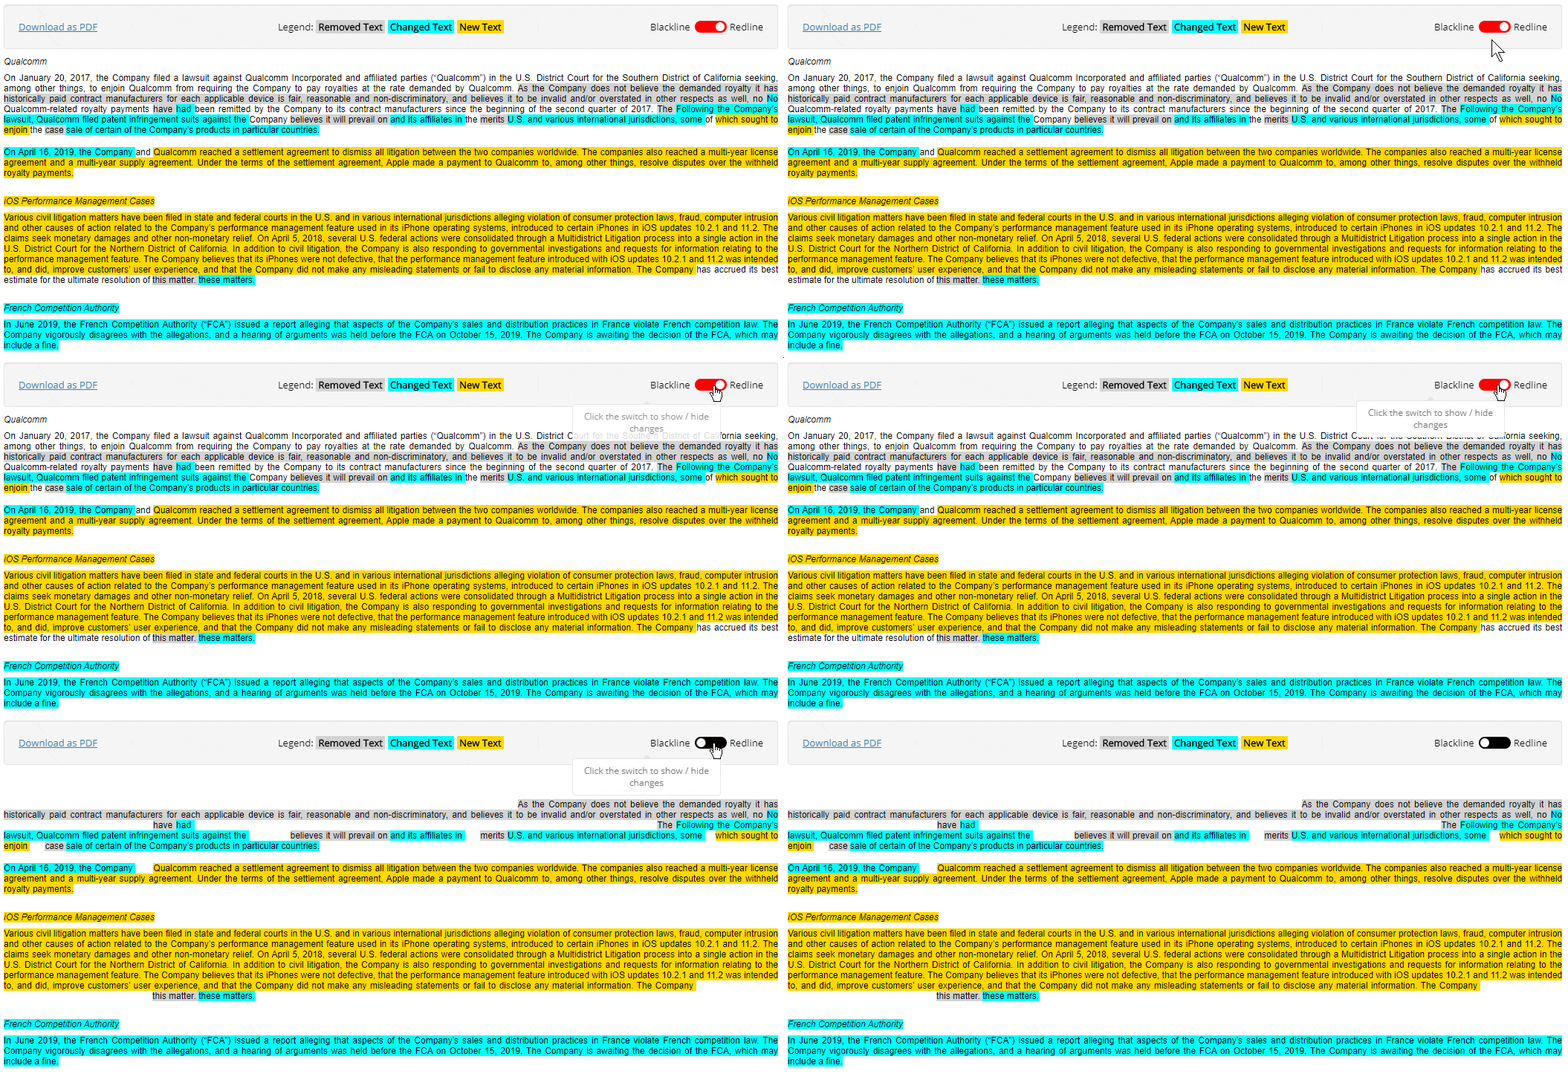
View differences made from one year to another to evaluate Newmarket Corp's financial trajectory

Compare SEC Filings Year-over-Year (YoY) and Quarter-over-Quarter (QoQ)
Sample 10-K Year-over-Year (YoY) Comparison

Compare this 10-K Annual Report to its predecessor by reading our highlights to see what text and tables were  removed  ,   added    and   changed   by Newmarket Corp.

Continue

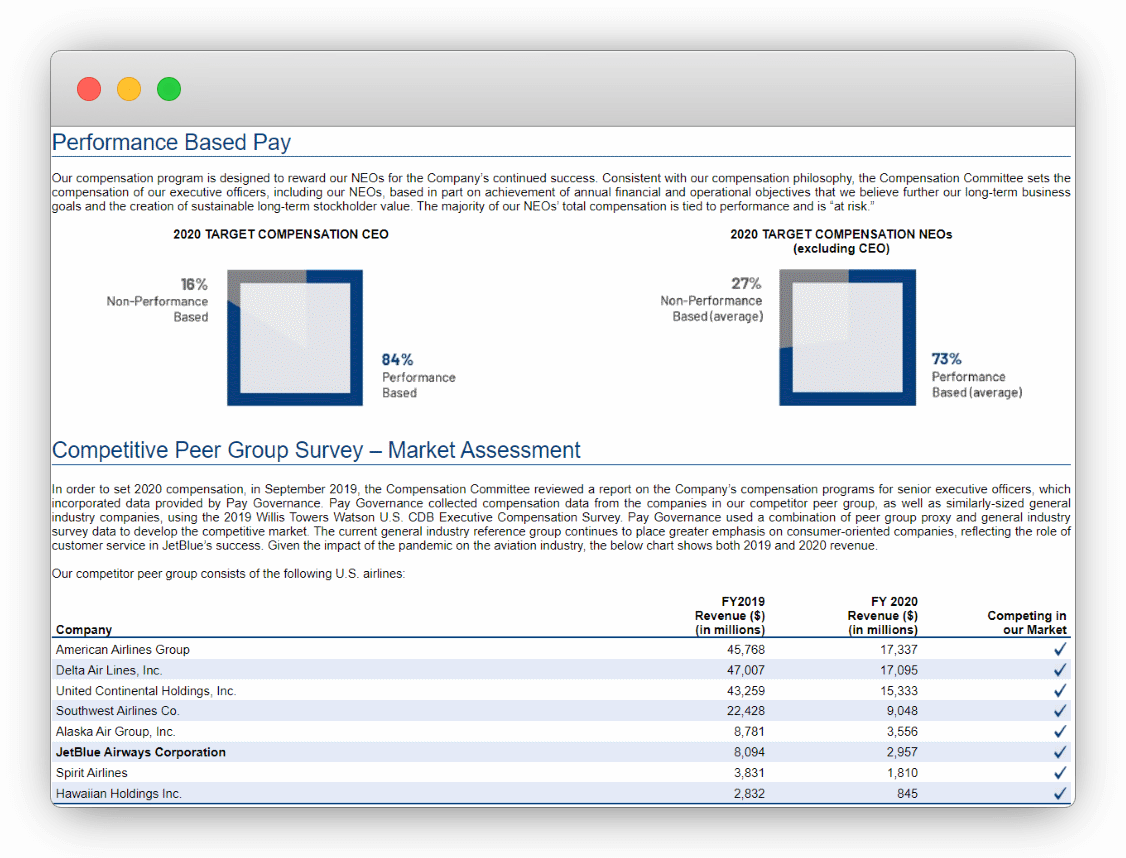
Assess how Newmarket Corp's management team is paid from their Annual Proxy

Definitive Proxy Statement (Form DEF 14A)
Screenshot example of actual Proxy Statement

Newmarket Corp's Definitive Proxy Statement (Form DEF 14A) filed after their 2016 10-K Annual Report includes:

  • Voting Procedures
  • Board Members
  • Executive Team
  • Salaries, Bonuses, Perks
  • Peers / Competitors

Continue

SEC Filing Tools

Financial Statements, Disclosures and Schedules

Inside this 10-K Annual Report

Document And Entity Information
Consolidated Balance Sheets
Consolidated Balance Sheets (parenthetical)
Consolidated Statements Of Cash Flows
Consolidated Statements Of Comprehensive Income
Consolidated Statements Of Comprehensive Income (parenthetical)
Consolidated Statements Of Income
Consolidated Statements Of Shareholders' Equity
Consolidated Statements Of Shareholders' Equity (parenthetical)
Accrued Expenses
Accrued Expenses (schedule Of Accrued Expenses) (details)
Accrued Expenses (tables)
Commitments And Contingencies
Commitments And Contingencies (contractual Commitments And Purchase Obligations) (details)
Commitments And Contingencies (environmental) (details)
Commitments And Contingencies (litigation) (details)
Commitments And Contingencies (tables)
Deferred Charges And Other Assets
Deferred Charges And Other Assets (schedule Of Deferred Charges And Other Assets) (details)
Deferred Charges And Other Assets (tables)
Derivatives And Hedging Activities
Derivatives And Hedging Activities (effect Of Derivative Instruments On The Consolidated Statements Of Income Non-designated Derivatives)(details)
Derivatives And Hedging Activities (fair Value Of Derivative Instruments) (details)
Derivatives And Hedging Activities (narrative) (details)
Derivatives And Hedging Activities (tables)
Discontinued Operations
Discontinued Operations (details)
Discontinued Operations (schedule Of Components Of Income From Operations Of Discontinued Business) (details)
Discontinued Operations (tables)
Earnings Per Share
Earnings Per Share (details)
Earnings Per Share (tables)
Fair Value Measurements
Fair Value Measurements (assets And Liabilities Measured At Fair Value On A Recurring Basis) (details)
Fair Value Measurements (estimated Fair Value Of Long-term Debt) (details)
Fair Value Measurements (tables)
Income Tax Expense
Income Tax Expense (deferred Income Tax Assets And Liabilities) (details)
Income Tax Expense (narrative) (details)
Income Tax Expense (reconciliation Of U.s. Federal Statutory Rate To Effective Income Tax Rate) (details)
Income Tax Expense (schedule Of Income From Continuing Operations Before Income Taxes And Provision For Income Taxes) (details)
Income Tax Expense (tables)
Intangibles (net Of Amortization) And Goodwill
Intangibles (net Of Amortization) And Goodwill (narrative) (details)
Intangibles (net Of Amortization) And Goodwill (schedule Of Estimated Annual Amortization Expense Related To Intangible Assets) (details)
Intangibles (net Of Amortization) And Goodwill (schedule Of Information Related To Intangible Assets) (details)
Intangibles (net Of Amortization) And Goodwill (tables)
Inventories
Inventories (narrative) (details)
Inventories (schedule Of Inventories) (details)
Inventories (tables)
Long-term Debt
Long-term Debt (narrative) (details)
Long-term Debt (schedule Of Long-term Debt) (details)
Long-term Debt (schedule Of Unused Portion Of Revolving Credit Facility) (details)
Long-term Debt (tables)
Other Comprehensive Income (loss) And Accumulated Other Comprehensive Loss
Other Comprehensive Income (loss) And Accumulated Other Comprehensive Loss (amounts Reclassified From Accumulated Other Comprehensive Loss) (details)
Other Comprehensive Income (loss) And Accumulated Other Comprehensive Loss (components Of Accumulated Other Comprehensive Loss) (details)
Other Comprehensive Income (loss) And Accumulated Other Comprehensive Loss (tables)
Other Income (expense), Net
Other Income (expense), Net (details)
Other Noncurrent Liabilities
Other Noncurrent Liabilities (schedule Of Other Noncurrent Liabilities) (details)
Other Noncurrent Liabilities (tables)
Pension Plans And Other Postretirement Benefits
Pension Plans And Other Postretirement Benefits (assumed Health Care Cost Trend Rates) (details)
Pension Plans And Other Postretirement Benefits (assumptions To Calculate The Results Of Our Retirement Plans) (details)
Pension Plans And Other Postretirement Benefits (changes In The Plans' Benefit Obligations And Assets) (details)
Pension Plans And Other Postretirement Benefits (expected Benefit Payments) (details)
Pension Plans And Other Postretirement Benefits (fair Value Of The Pension And Postretirement Benefit Plans Assets By Asset Category) (details)
Pension Plans And Other Postretirement Benefits (narrative) (details)
Pension Plans And Other Postretirement Benefits (pension Plans With The Benefit Obligation In Excess Of Plan Assets) (details)
Pension Plans And Other Postretirement Benefits (summary Of Components Of Net Periodic Benefit Cost) (details)
Pension Plans And Other Postretirement Benefits (tables)
Prepaid Expenses And Other Current Assets
Prepaid Expenses And Other Current Assets (schedule Of Prepaid Expenses And Other Current Assets) (details)
Prepaid Expenses And Other Current Assets (tables)
Property, Plant, And Equipment, At Cost
Property, Plant, And Equipment, At Cost (narrative) (details)
Property, Plant, And Equipment, At Cost (schedule Of Property, Plant, And Equipment, At Cost) (details)
Property, Plant, And Equipment, At Cost (schedule Of Useful Lives Of Property, Plant, And Equipment) (details)
Property, Plant, And Equipment, At Cost (tables)
Recently Issued Accounting Pronouncements
Segment And Geographic Area Information
Segment And Geographic Area Information (schedule Of Additions To Long-lived Assets And Depreciation And Amortization) (details)
Segment And Geographic Area Information (schedule Of Asset Information By Segment) (details)
Segment And Geographic Area Information (schedule Of Revenue And Operating Profit By Segment) (details)
Segment And Geographic Area Information (schedule Of Revenue By Geographic Area) (details)
Segment And Geographic Area Information (tables)
Selected Quarterly Consolidated Financial Data (unaudited)
Selected Quarterly Consolidated Financial Data (unaudited) (schedule Of Selected Quarterly Consolidated Financial Data) (details)
Selected Quarterly Consolidated Financial Data (unaudited) (tables)
Stock-based Compensation
Stock-based Compensation (narrative) (details)
Stock-based Compensation (schedule Of Restricted Stock And Restricted Stock Unit Activity) (details)
Stock-based Compensation (tables)
Summary Of Significant Accounting Policies
Summary Of Significant Accounting Policies (details)
Summary Of Significant Accounting Policies (policy)
Supplemental Cash Flow Information
Supplemental Cash Flow Information (schedule Of Cash Flow Information) (details)
Supplemental Cash Flow Information (tables)
Trade And Other Accounts Receivable, Net
Trade And Other Accounts Receivable, Net (schedule Of Trade And Other Accounts Receivable, Net) (details)
Trade And Other Accounts Receivable, Net (tables)
Ticker: NEU
CIK: 1282637
Form Type: 10-K Annual Report
Accession Number: 0001282637-16-000028
Submitted to the SEC: Fri Feb 12 2016 11:26:17 AM EST
Accepted by the SEC: Fri Feb 12 2016
Period: Thursday, December 31, 2015
Industry: Industrial Organic Chemicals

External Resources:
Stock Quote
Social Media
SEC.gov

Bookmark the Permalink:
https://last10k.com/sec-filings/neu/0001282637-16-000028.htm