Please wait while we load the requested 10-K report or click the link below:
https://last10k.com/sec-filings/report/1579252/000157925219000028/jasonindustries1231201810k.htm
June 2020
June 2020
June 2020
June 2020
June 2020
May 2020
May 2020
May 2020
April 2020
April 2020

• | Net sales of $132.0 million decreased 9.3 percent and included a negative 1.1 percent impact from the divestiture and planned exit of non-core businesses in the margin expansion program and a negative 0.9 percent from foreign currency translation. |
• | Operating loss of $0.4 million or 0.3 percent of net sales, increased $1.9 million, impacted by $1.4 million of accelerated depreciation related to the closure of the Richmond, Indiana Acoustics facility and a $1.3 million gain on the sale of the Nuneaton, United Kingdom Seating facility. |
• | Net loss of $12.4 million, or $0.48 diluted loss per share, increased $14.8 million or $0.53 per share, significantly impacted by a discrete tax benefit in 2017 of $3.8 million from enactment of the Tax Cut and Jobs Act (the “Tax Act”), and incremental tax expense in 2018 of $6.0 million resulting from provisions of the Tax Act. |
• | Free cash flow was $5.6 million, an increase of $5.5 million, due to lower working capital and capital expenditures. |
• | Adjusted EBITDA of $10.9 million, or 8.3 percent of net sales, decreased $1.6 million from 8.6 percent of net sales, driven primarily by lower sales volumes with material inflation largely offset by operational improvements and price. |
• | Adjusted net loss of $12.5 million, or $0.40 Adjusted loss per share, decreased $0.39 per share. |
• | Net sales of $612.9 million decreased 5.5 percent and included a negative 2.9 percent impact from the divestiture and planned exit of non-core businesses and a positive 0.8 percent from foreign currency translation. |
• | Adjusted EBITDA of $67.2 million, or 11.0 percent of net sales, with Adjusted EBITDA margins increasing from 10.4 percent of net sales. Adjusted EBITDA margin expansion was driven by improved operational efficiencies. |
• | Free cash flow was $16.0 million, an increase of $1.8 million, due to lower capital expenditures, reduced working capital, partially offset by higher cash restructuring. |
• | Total Cost Reduction and Margin Expansion program savings were $0.4 million in the fourth quarter with a total of $23 million since the inception of the program. Actions taken and announced to-date will achieve the three-year program goal of $25 million, and the Company will continue to evaluate cost reduction and footprint rationalization opportunities as part of its normal operating activities. |
• | Completed the sale and consolidation of the Nuneaton, United Kingdom Seating facility. Net proceeds from the sale were $3.5 million. |
• | Finishing net sales of $47.2 million decreased $2.8 million, or 5.6 percent, including a negative foreign currency translation impact of 2.5 percent. Organic sales decreased 3.1 percent and were impacted by lower volumes in a weakening European industrial economy partially offset by growth in North America end markets. Adjusted EBITDA was $5.2 million, or 10.9 percent of net sales, a decrease of $0.6 million from 11.5 percent of net sales. Adjusted EBITDA decreased on lower volumes and investments in selling resources to drive targeted growth. |
• | Components net sales of $14.7 million decreased $5.2 million, or 26.1 percent, including a negative 8.1 percent impact from the exit of the non-core smart meter product line. Organic sales decreased 18.0 percent due to decreased rail and expanded metals product volumes resulting from unfavorable content mix and heightened competitive pressures. |
Please wait while we load the requested 10-K report or click the link below:
https://last10k.com/sec-filings/report/1579252/000157925219000028/jasonindustries1231201810k.htm
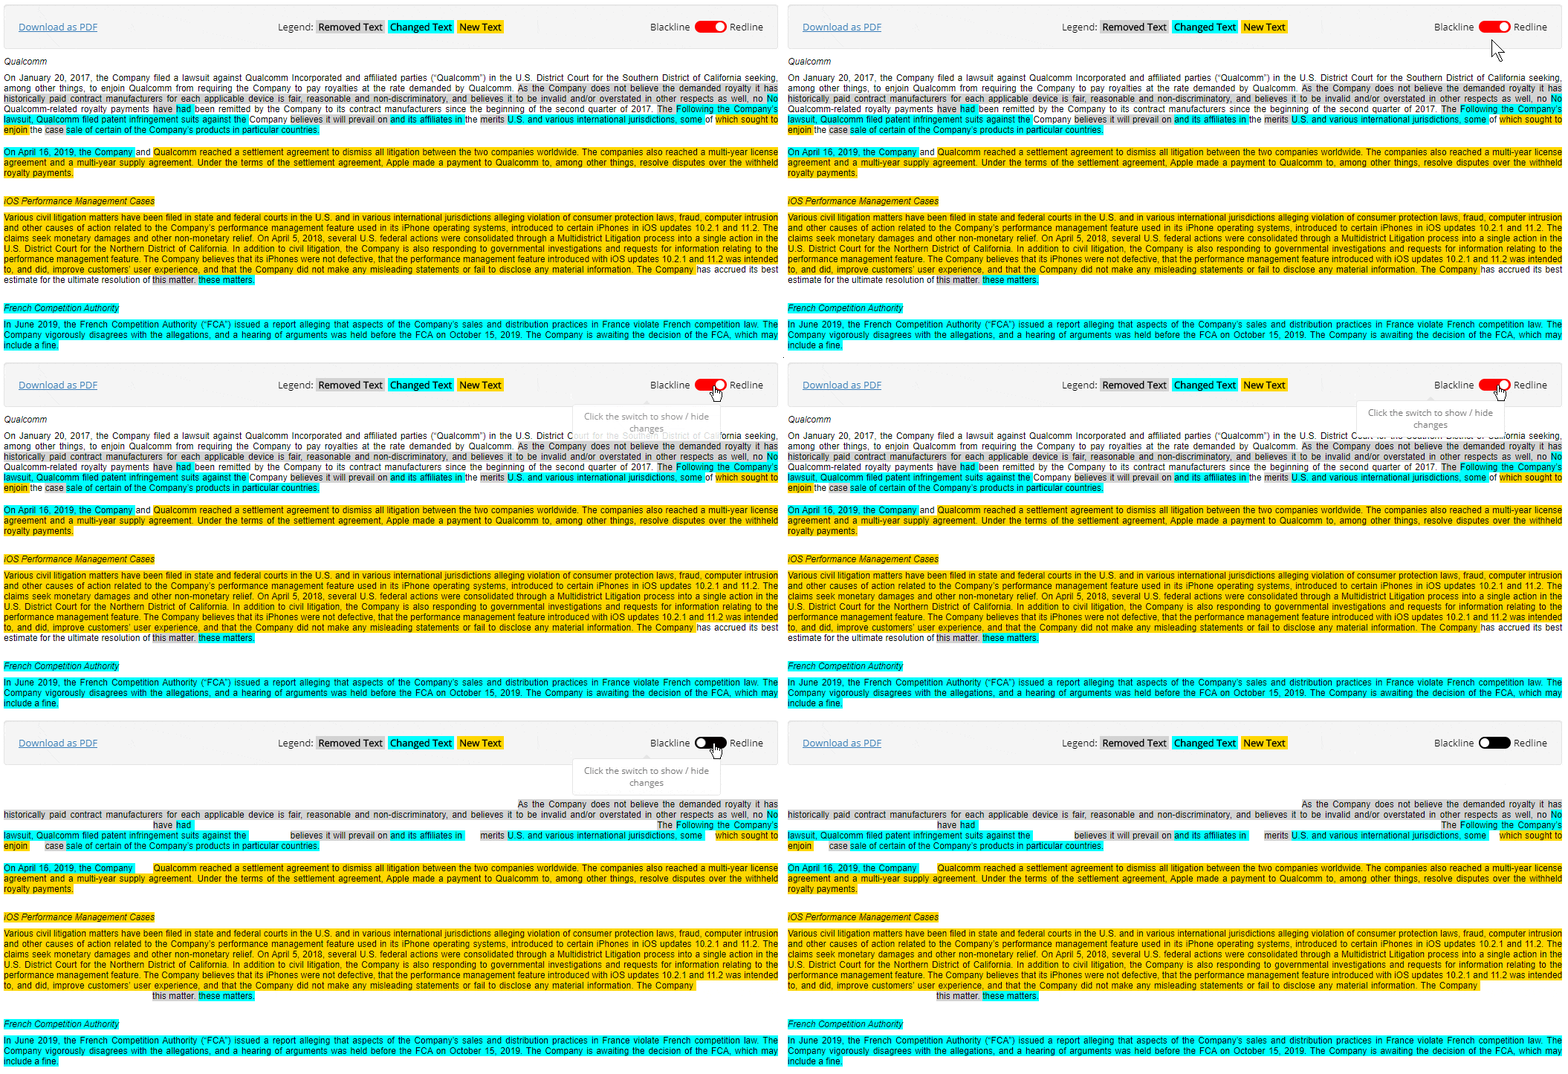
Compare this 10-K Annual Report to its predecessor by reading our highlights to see what text and tables were removed , added and changed by Jason Industries, Inc..
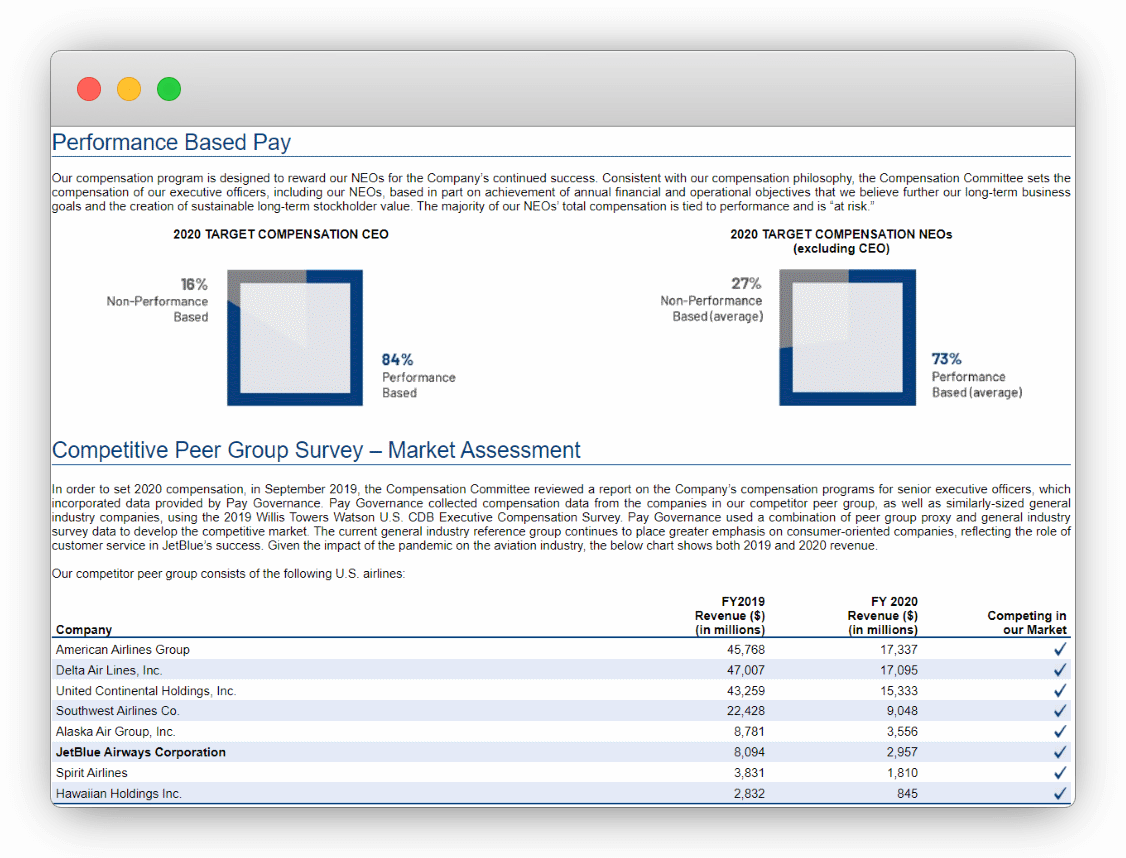
Jason Industries, Inc.'s Definitive Proxy Statement (Form DEF 14A) filed after their 2019 10-K Annual Report includes:
Rating
Learn More
The decrease in Adjusted EBITDA for the year ended December 31, 2017 primarily resulted from lower volume in the rail market and unfavorable product mix, increases in raw material prices primarily due to steel purchases, lower labor productivity on decreased volumes and increased incentive compensation due to increased attainment percentages, partially offset by decreased selling and administrative expenses from other spending controls and $0.9 million as a result of the strategic decision to discontinue certain product lines selling under the Assembled Products brand in 2016 that were not profitable.
Retirement and Mortality Rates: The Companys retirement and mortality rate assumptions are based primarily on actual plan experience and mortality tables.
However, if the North American rail industry declines or experiences less growth than anticipated, customers in-source production, and/or U.S. GDP is flat or shrinks, there could be reduced demand for the components segments products, which would have a material negative impact on the components segments net sales and/or income from continuing operations.
Included within the restructuring costs for the wind down of the Brazil facility are charges related to a loss contingency for certain employment matter claims.
The employee retirement plan gain for the year ended December 31, 2017 primarily related to actuarial gains recognized in U.S. pension and postretirement health care benefit plans within our finishing segment due to higher actual plan asset returns compared with the expected returns on plan assets and a decrease in expected future claim costs, respectively, partially offset by actuarial losses recognized in a German pension plan within our finishing segment due to an increase in future expected compensation.
However, if such industries weaken...Read more
The employee retirement plan gain...Read more
While the Company believes its...Read more
During 2016, such costs primarily...Read more
The decrease in cost of...Read more
If the industry weakens more...Read more
See "Key Measures the Company...Read more
The Senior Secured Credit Facilities...Read more
Goodwill No amortization Patents Amortized...Read more
Restructuring includes costs associated with...Read more
Such costs include direct and...Read more
The decrease is primarily due...Read more
On a constant currency basis...Read more
Certain corporate level administrative expenses...Read more
The Company?s tax benefit is...Read more
The decrease was also due...Read more
The table below presents the...Read more
The table below presents the...Read more
Expected Return on Plan Assets:...Read more
Borrowings under these facilities totaled...Read more
Changes in foreign currency exchange...Read more
The gain on disposals of...Read more
The gain on disposals of...Read more
Gain on disposals of property,...Read more
Holders of the 40,612 shares...Read more
The decrease was primarily due...Read more
The Company recognizes revenue over...Read more
See "Key Measures the Company...Read more
For the limited contracts with...Read more
The reduced costs resulting from...Read more
The employee retirement plan loss...Read more
The decrease in net sales...Read more
The 2016 effective tax rate...Read more
Excluding currency impact, the increase...Read more
The divestiture resulted in an...Read more
In 2016, integration and other...Read more
The increase in proceeds from...Read more
The decrease was driven by...Read more
The increase was driven by...Read more
The increase in Adjusted EBITDA...Read more
To achieve this target, our...Read more
Based on information provided by...Read more
The following table sets forth...Read more
The increase in Adjusted EBITDA...Read more
Adjusted EBITDA for the year...Read more
Adjusted EBITDA for the year...Read more
The decline in the estimated...Read more
Health Care Cost Trend Rates:...Read more
Excluding currency impact, the increase...Read more
Excluding currency impact, the increase...Read more
The Company is also focused...Read more
Cash flows provided by operating...Read more
The supplier incident had resulted...Read more
For the year ended December...Read more
Employee retirement plan adjustments was...Read more
Employee retirement plan adjustments was...Read more
The Company?s strategic initiatives support...Read more
The effective interest rate on...Read more
The effective interest rate on...Read more
The Senior Secured Credit Facilities...Read more
Key Events In addition to...Read more
This change coincided with the...Read more
The increase reflects higher Adjusted...Read more
During 2018, other income-net also...Read more
The increase in cash paid...Read more
Sales in the components segment...Read more
Management believes that Adjusted EBITDA...Read more
The Company defines Adjusted EBITDA...Read more
Adjusted EBITDA as a percentage...Read more
These non-GAAP financial measures are...Read more
Reduction of fixed costs through...Read more
The decrease in cash flows...Read more
The Company paid the following...Read more
Higher working capital reductions in...Read more
Readers of this MD&A; should...Read more
In 2018, integration and other...Read more
Selling and administrative expenses were...Read more
As required by GAAP, when...Read more
As of December 31, 2018,...Read more
As of December 31, 2017,...Read more
During 2017, such costs were...Read more
During 2017, such costs were...Read more
Foreign currency translation adjustments are...Read more
Foreign currency translation adjustments are...Read more
In addition, cash flows used...Read more
Changes in foreign currency exchange...Read more
Changes in foreign currency exchange...Read more
Selling and administrative expenses were...Read more
Regarding economic conditions, as discussed...Read more
Product Innovation - During the...Read more
No borrowings were outstanding under...Read more
As of December 31, 2018,...Read more
As of December 31, 2017,...Read more
The increase in Adjusted EBITDA...Read more
The goodwill impairment charges are...Read more
Corporate expense is principally comprised...Read more
This seasonality and annual variations...Read more
The reduced costs resulting from...Read more
The decrease in Adjusted EBITDA...Read more
The decrease of $1.4 million...Read more
During 2018, such costs were...Read more
Contracts entered into with the...Read more
Gain on extinguishment of debt...Read more
Reconciliations of EBITDA and Adjusted...Read more
On March 1, 2016, the...Read more
Other than payments required with...Read more
The gain on disposals of...Read more
(5) (Gain) loss on disposals...Read more
If the carrying amount of...Read more
The decrease was partially offset...Read more
Management believes that North American...Read more
Other long-term liabilities primarily consist...Read more
See Note 4, "Restructuring Costs"...Read more
Net sales reflect the Company?s...Read more
Other income is principally comprised...Read more
The 2018 effective tax rate...Read more
Application of these accounting policies...Read more
Other than the payment of...Read more
On a constant currency basis...Read more
For the year ended December...Read more
For the year ended December...Read more
For the year ended December...Read more
For the year ended December...Read more
For the year ended December...Read more
Changes in net operating working...Read more
The Company?s individual businesses monitor...Read more
The decrease of $44.6 million...Read more
The decrease of $43.3 million...Read more
If such outstanding amounts do...Read more
The decrease in Adjusted EBITDA...Read more
The Swaps have been designated...Read more
Dividends shall be paid in...Read more
In connection with the evaluation...Read more
In addition, following acquisitions, cost...Read more
Gain (loss) on disposals of...Read more
The majority of the Company?s...Read more
The Company performed its annual...Read more
As of December 31, 2018,...Read more
The decrease reflects lower Adjusted...Read more
Fluctuations in cost of goods...Read more
The estimated fair value represents...Read more
Net gain attributable to noncontrolling...Read more
Lower capital expenditures of $2.1...Read more
Financial Statements, Disclosures and Schedules
Inside this 10-K Annual Report
Material Contracts, Statements, Certifications & more
Jason Industries, Inc. provided additional information to their SEC Filing as exhibits
Ticker: JASN
CIK: 1579252
Form Type: 10-K Annual Report
Accession Number: 0001579252-19-000028
Submitted to the SEC: Tue Mar 05 2019 11:32:03 AM EST
Accepted by the SEC: Tue Mar 05 2019
Period: Monday, December 31, 2018
Industry: Miscellaneous Manufacturing Industries

