Please wait while we load the requested 10-K report or click the link below:
https://last10k.com/sec-filings/report/1428336/000142833624000016/hqy-20240131.htm
May 2024
April 2024
April 2024
March 2024
March 2024
February 2024
January 2024
December 2023
September 2023
September 2023
Please wait while we load the requested 10-K report or click the link below:
https://last10k.com/sec-filings/report/1428336/000142833624000016/hqy-20240131.htm
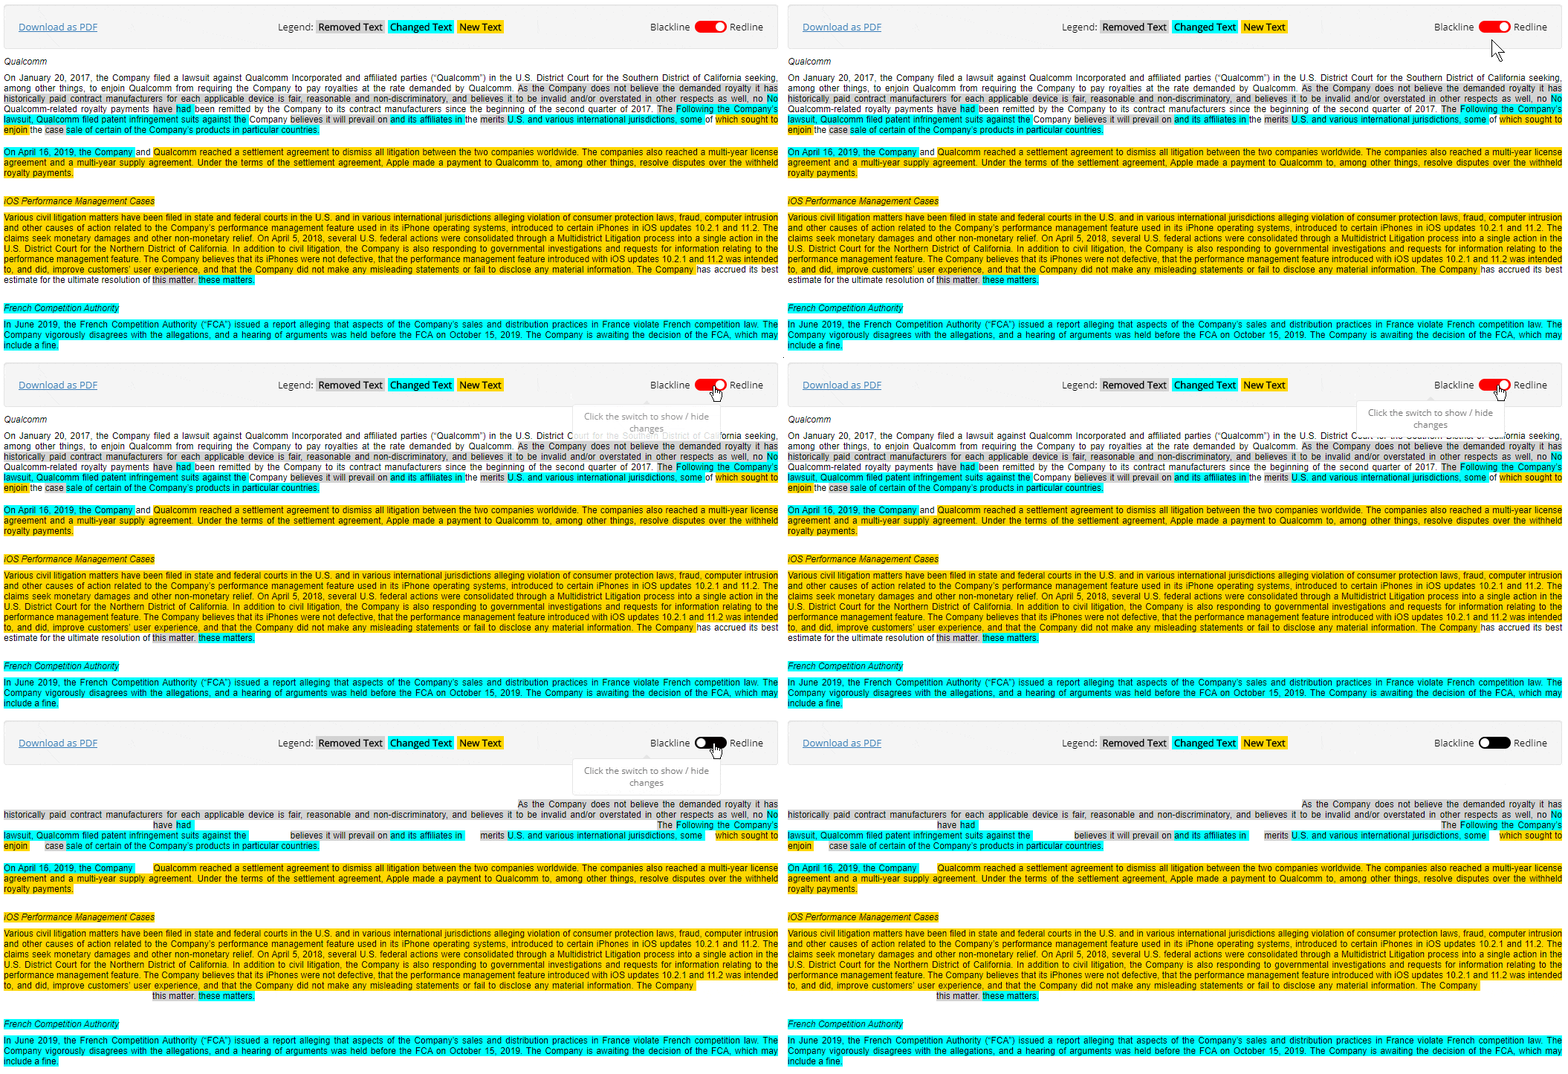
Compare this 10-K Annual Report to its predecessor by reading our highlights to see what text and tables were removed , added and changed by Healthequity Inc.
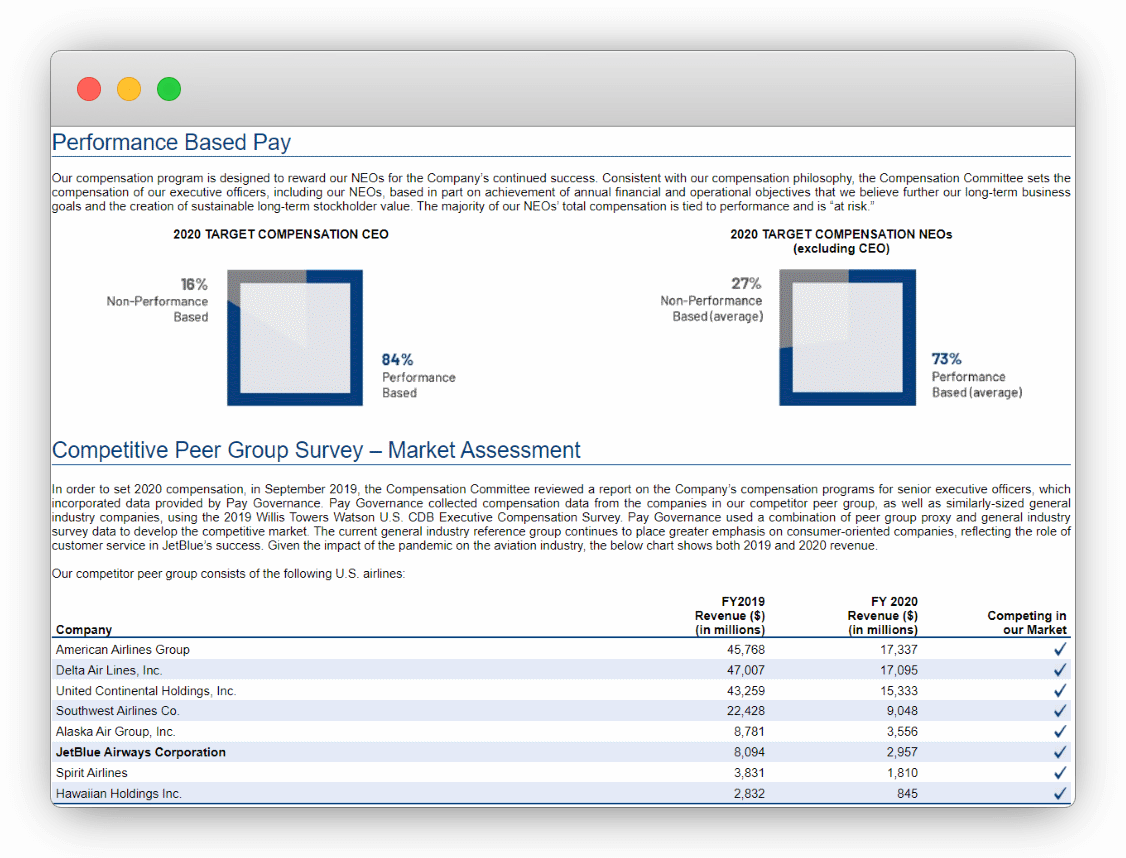
Healthequity Inc's Definitive Proxy Statement (Form DEF 14A) filed after their 2024 10-K Annual Report includes:
Rating
Learn More
In many instances, we could have reasonably used different accounting estimates, and in other instances, changes in the accounting estimates are reasonably likely to occur from period to period.
We evaluate our tax positions in accordance with Accounting Standards Codification (“ASC”) 740-10-25, Accounting for Uncertainty in Income Taxes, which prescribes a recognition threshold and measurement attribute for a tax position taken or expected to be taken in a tax return.
Accordingly, actual results could differ significantly from the estimates made by our management.
Moreover, changes in healthcare policy, such as "Medicare for all" plans, could materially and adversely affect our business in ways that are difficult to predict.
However, the timing and impact of these and other developments in U.S. healthcare are uncertain.
As of January 31, 2024, we...Read more
We expect our general and...Read more
Valuation allowances are established when...Read more
The $12.0 million, or 14%,...Read more
However, on an annual basis,...Read more
We plan to continue this...Read more
Our ability to predict and...Read more
Assuming the current interest rate...Read more
Capital expenditures to improve the...Read more
We believe that innovations incorporated...Read more
We believe that continued growth...Read more
The $11.8 million, or 14%,...Read more
The $36.0 million, or 23%,...Read more
Amortization of acquired intangible assets...Read more
Due to the substantiation requirement...Read more
For example, we are making...Read more
The interest rate on our...Read more
Net cash provided by operating...Read more
As of January 31, 2024, there...Read more
The average family premium for...Read more
Total HSA Assets increased by...Read more
Our Clients and their benefits...Read more
The $25.4 million, or 13%,...Read more
Our Credit Agreement includes a...Read more
Luum provides employers with various...Read more
We are the largest custodian...Read more
Net cash used in financing...Read more
The remainder of the increase...Read more
As of January 31, 2024, other...Read more
Recent interest rate increases have...Read more
We have increased our share...Read more
We use our innovative technology...Read more
We allocate the fair value...Read more
HSA members who place their...Read more
Our success depends in part...Read more
Total revenue increased by $137.8...Read more
We derive revenue primarily from...Read more
Our Term Loan Facility had...Read more
The $8.4 million, or 2%,...Read more
The number of our HSAs...Read more
The transfer is expected to...Read more
We also reclassified certain immaterial...Read more
HSA investments increased by $2.3 billion,...Read more
We expect our technology and...Read more
We believe that our future...Read more
As part of our services,...Read more
In March 2021, we bolstered...Read more
We believe that there are...Read more
Significant estimates in valuing certain...Read more
Total revenue increased by $105.2...Read more
We rely on cash provided...Read more
In addition, we expect an...Read more
Our current innovation efforts include,...Read more
Many of these are state...Read more
Our Term Loan Facility had...Read more
HSA cash increased by $0.8 billion,...Read more
We have historically acquired HSA...Read more
Our ability to assist consumers...Read more
The decrease in income tax...Read more
The $21.6 million, or 17%,...Read more
HSA cash held by our...Read more
Allocation of purchase consideration to...Read more
Seasonal concentration of our growth...Read more
We invest in and intend...Read more
We are a leader and...Read more
Our principal sources of liquidity...Read more
In the event that additional...Read more
Beginning in the fiscal year...Read more
Certain reclassifications have been made...Read more
Other income (expense), net, consists...Read more
Interchange costs are comprised of...Read more
Our other CDB administration competitors...Read more
With our CDB capabilities, we...Read more
We base our estimates on...Read more
Privacy regulation in particular has...Read more
Our commuter benefits offering also...Read more
We seek to differentiate ourselves...Read more
We believe our existing cash,...Read more
We use the asset and...Read more
Our success depends on our...Read more
The number of our HSAs...Read more
For the fiscal years ended...Read more
The $10.4 million, or 15%,...Read more
The $8.9 million, or 6%,...Read more
We recognize revenue on a...Read more
Our proprietary technology allows us...Read more
Capital expenditures for the fiscal...Read more
We review goodwill for impairment...Read more
For the reasons described below,...Read more
The education and customer service...Read more
Sales and marketing expenses consist...Read more
For the fiscal years ended...Read more
relationships, acquired developed technology, and...Read more
These deposits are amounts remitted...Read more
On an annual basis, we...Read more
The $4.5 million, or 22%,...Read more
Such factors, and the response...Read more
Such factors, and the response...Read more
Some of our direct competitors...Read more
We have developed an internal...Read more
These significant policies and our...Read more
In addition, numerous indirect competitors,...Read more
As of January 31, 2024 and...Read more
We are currently investing in...Read more
The $1.8 million, or 2%,...Read more
However, our general and administrative...Read more
We expect to continue our...Read more
A shelf registration statement, which includes a...Read more
Management’s judgment is required in...Read more
As of January 31, 2024, we...Read more
However, our technology and development...Read more
The $1.9 million, or 8%,...Read more
We evaluate our acquired intangible...Read more
The excess of the fair...Read more
Such valuations require management to...Read more
Federal law and regulations, including...Read more
We expect to pay approximately...Read more
Our full suite of CDB...Read more
We generate revenue from three...Read more
We recognize interchange revenue monthly...Read more
The $26.9 million, or 9%,...Read more
Upon the conclusion of the...Read more
Technology and development expenses also...Read more
On March 7, 2024, the first...Read more
The $36.2 million, or 56%,...Read more
We reach consumers primarily through...Read more
Revenue results are seasonally impacted...Read more
We expect service revenue to...Read more
Interest on our Term Loan...Read more
Interest on our Term Loan...Read more
In March 2022, we acquired...Read more
They also include depreciation, amortization,...Read more
In April 2023, we used...Read more
We expect our sales and...Read more
The $18.2 million, or 64%,...Read more
The $6.2 million, or 6%,...Read more
The number of our CDBs...Read more
The agreement contemplates a transfer...Read more
Client-held funds are interest-earning deposits...Read more
These expenses begin to ramp...Read more
Deferred tax assets and liabilities...Read more
The $10.2 million, or 17%,...Read more
A successful healthcare consumer needs...Read more
To the extent these current...Read more
Each of these factors presents...Read more
On an annual basis, we...Read more
The $3.7 million, or 1%,...Read more
For example, our subsidiary HealthEquity...Read more
If such review indicates that...Read more
Technology and development expenses include...Read more
On an annual basis, we...Read more
According to Devenir, as of...Read more
In September 2021, we acquired...Read more
To the extent that there...Read more
The evaluation is performed at...Read more
Various states also have laws...Read more
We earn interchange revenue mainly...Read more
Expenditures include personnel-related costs, depreciation,...Read more
As Basic Rates contracts mature,...Read more
In connection with this transfer,...Read more
Our gross profit is our...Read more
This revenue is collected each...Read more
Client-held funds fluctuate depending on...Read more
The $10.4 million in merger...Read more
In September 2023, we entered...Read more
In addition to fixed per...Read more
We were in compliance with...Read more
Merger integration expenses include personnel...Read more
We believe that there are...Read more
In connection with the BenefitWallet...Read more
We earn interchange revenue each...Read more
However, our sales and marketing...Read more
These costs of services relate...Read more
Changes in tax policy are...Read more
We are subject to federal...Read more
In addition, state-level regulations also...Read more
Recoverability of these assets is...Read more
Privacy and data security-related laws...Read more
purchases of software and capitalized...Read more
The interest rates retained by...Read more
However, in the ordinary course...Read more
Measuring HSA Assets is important...Read more
Over longer periods, sustained shifts...Read more
Long-lived assets, including property and...Read more
reaches a certain threshold, the...Read more
In addition, we expect to...Read more
The $1.2 million, or less...Read more
On an annual basis, we...Read more
During the measurement period, which...Read more
Interest expense consists primarily of...Read more
The core of our offerings...Read more
General and administrative expenses include...Read more
We account for the costs...Read more
Financial Statements, Disclosures and Schedules
Inside this 10-K Annual Report
Material Contracts, Statements, Certifications & more
Healthequity Inc provided additional information to their SEC Filing as exhibits
Ticker: HQY
CIK: 1428336
Form Type: 10-K Annual Report
Accession Number: 0001428336-24-000016
Submitted to the SEC: Fri Mar 22 2024 4:01:19 PM EST
Accepted by the SEC: Fri Mar 22 2024
Period: Wednesday, January 31, 2024
Industry: Business Services

