Last10K.com

Gamestop Corp. (GME) SEC Filing 10-K Annual report for the fiscal year ending Saturday, January 28, 2012

SEC Filings

Gamestop Corp.

CIK: 1672688 Ticker: GME

Exhibit 99.1

GameStop Reports Sales and Earnings for Fiscal 2011

Adjusted full year earnings in-line with guidance

2011 digital receipts grew 57% to $453 million

Strong fiscal 2012 outlook issued

GRAPEVINE, Texas--(BUSINESS WIRE)--March 22, 2012--GameStop Corp. (NYSE: GME), the world’s largest multichannel video game retailer, today reported sales and earnings for the fourth quarter and fiscal year ended Jan. 28, 2012.

Fourth Quarter Results

Total global sales for the fourth quarter of 2011 were $3.58 billion compared to $3.69 billion in the prior year quarter, a decrease of 3.0%. Consolidated comparable store sales decreased 3.6% compared to the prior year quarter.

Excluding restructuring, impairment and debt retirement expenses, GameStop’s adjusted net earnings for the fourth quarter were $239.5 million compared to adjusted net earnings of $238.8 million in the prior year quarter. Adjusted diluted earnings per share, excluding restructuring, impairment and debt retirement expenses, were in-line with guidance at $1.73, a 10% increase compared to adjusted diluted earnings per share of $1.57 in the prior year quarter.

During the fourth quarter of fiscal 2011, the company recorded asset impairment and restructuring charges of $81.2 million ($64.6 million, net of tax benefits), or $0.47 per share, to record international trade name impairment, exit certain international markets and non-core businesses, and close underperforming stores. The charges included fixed asset impairments, severance costs and lease termination fees. A reconciliation of non-GAAP adjusted net income to GAAP net income is included with this release (Schedule III).

For the fourth quarter, GameStop’s net earnings were $174.7 million compared to net earnings of $237.8 million in the prior year quarter. Diluted earnings per share were $1.27 compared to diluted earnings per share of $1.56 in the prior year quarter.

Fiscal 2011 Results

Paul Raines, chief executive officer, stated, “In 2011, GameStop outperformed the video game market through disciplined execution of its core business and strategic initiatives. For 2012, we project operating earnings growth based on the continuation of our transformation, led by our strong pre-owned business, expanding digital offerings and emerging mobile categories.”

For fiscal year 2011, total global sales were $9.55 billion, a modest increase over fiscal 2010. Full year consolidated comparable store sales declined 2.1% compared to fiscal 2010. By product category, sales in new hardware and other declined, while the company posted increases in both new and pre-owned software sales. Digital receipts, which are included in the other category, increased 57%.

Excluding restructuring, impairment and debt retirement expenses, GameStop’s adjusted net earnings for fiscal year 2011 were $405.1 million compared to adjusted net earnings of $412.8 million in fiscal 2010. Adjusted diluted earnings per share, excluding restructuring, impairment and debt retirement expenses, were $2.87, a 7.0% increase compared to adjusted diluted earnings per share of $2.68 in fiscal 2010.

For fiscal year 2011, GameStop’s net earnings were $339.9 million compared to net earnings of $408.0 million in fiscal 2010. Diluted earnings per share were $2.41 compared to diluted earnings per share of $2.65 in fiscal 2010.


The following information was filed by Gamestop Corp. (GME) on Monday, March 26, 2012 as an 8K 2.02 statement, which is an earnings press release pertaining to results of operations and financial condition. It may be helpful to assess the quality of management by comparing the information in the press release to the information in the accompanying 10-K Annual Report statement of earnings and operation as management may choose to highlight particular information in the press release.

View differences made from one year to another to evaluate Gamestop Corp.'s financial trajectory

Compare SEC Filings Year-over-Year (YoY) and Quarter-over-Quarter (QoQ)
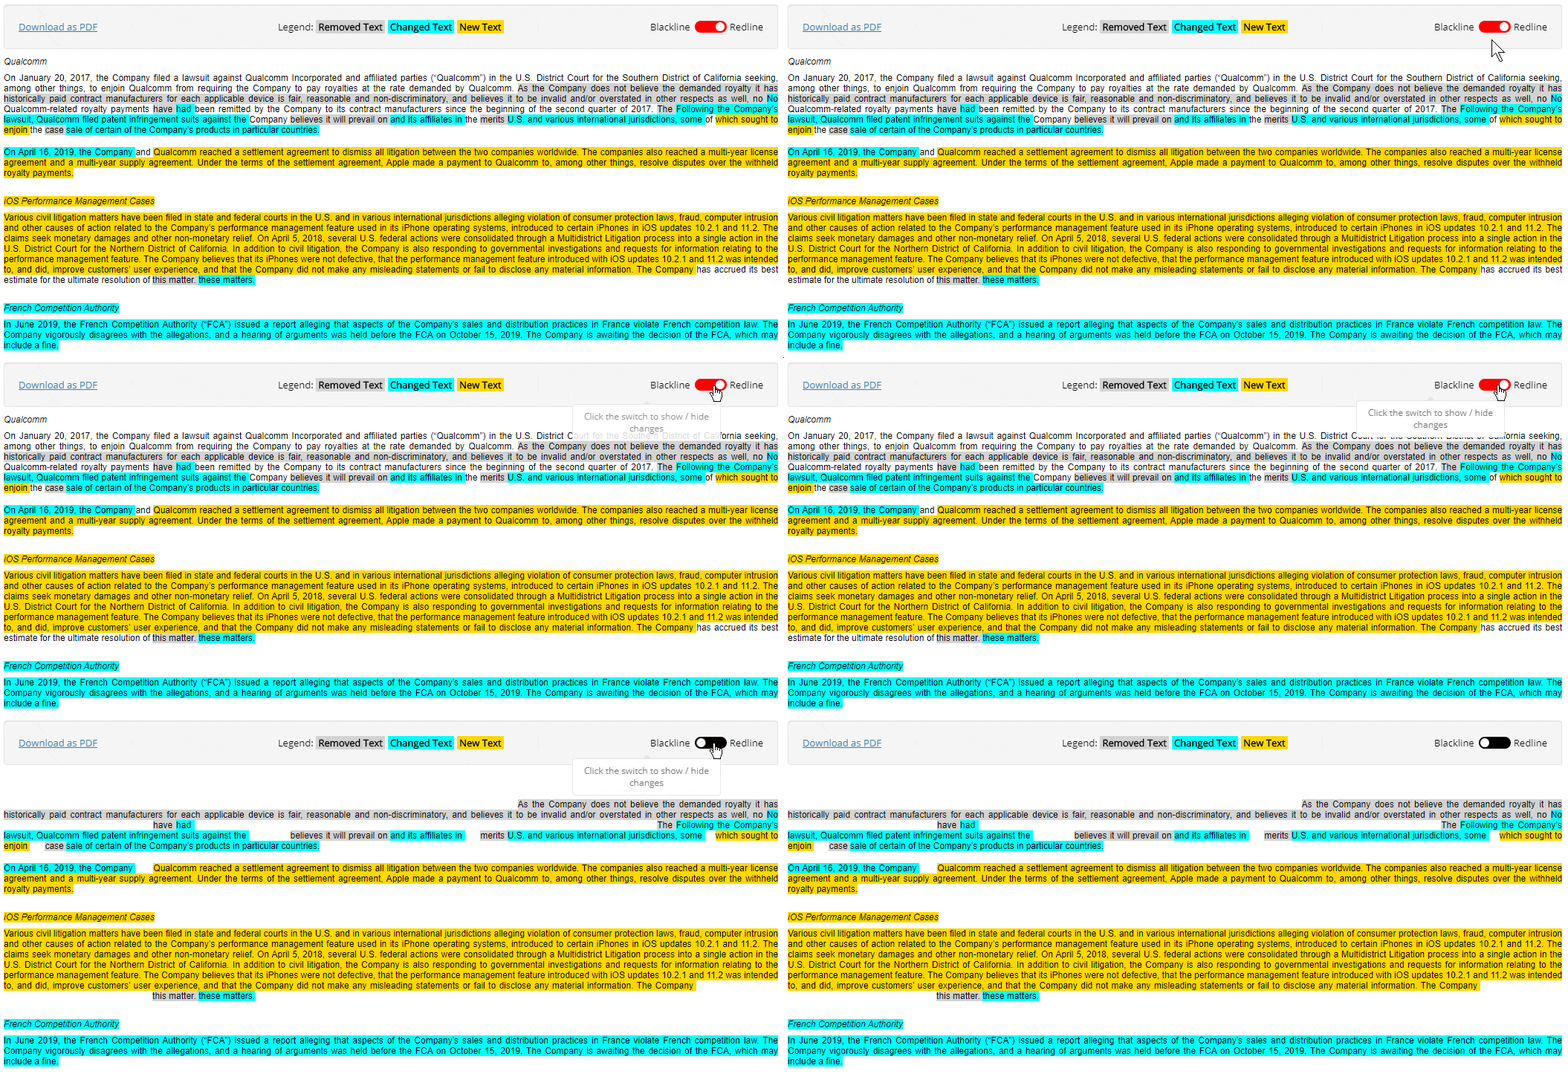
Sample 10-K Year-over-Year (YoY) Comparison

Compare this 10-K Annual Report to its predecessor by reading our highlights to see what text and tables were  removed  ,   added    and   changed   by Gamestop Corp..

Continue

Assess how Gamestop Corp.'s management team is paid from their Annual Proxy

Definitive Proxy Statement (Form DEF 14A)
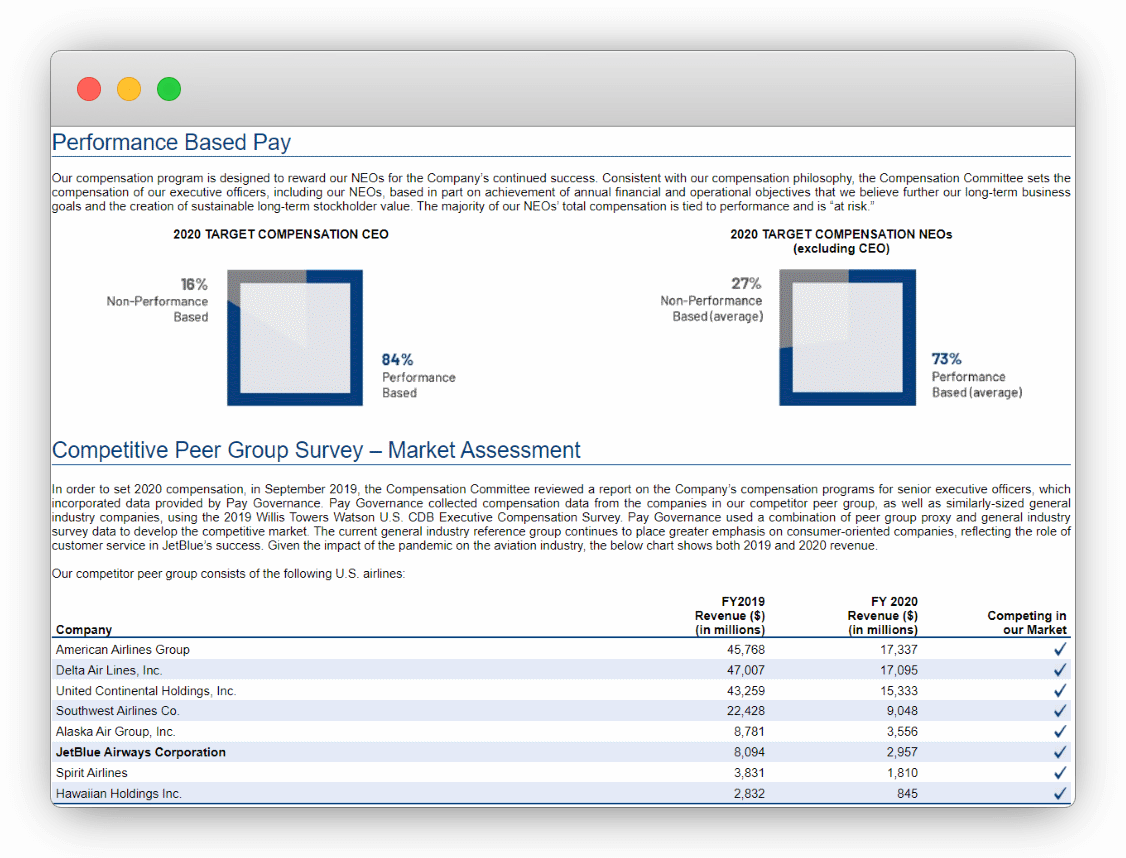
Screenshot example of actual Proxy Statement

Gamestop Corp.'s Definitive Proxy Statement (Form DEF 14A) filed after their 2012 10-K Annual Report includes:

  • Voting Procedures
  • Board Members
  • Executive Team
  • Salaries, Bonuses, Perks
  • Peers / Competitors

Continue

SEC Filing Tools

Financial Statements, Disclosures and Schedules

Inside this 10-K Annual Report

Document And Entity Information
Consolidated Balance Sheets
Consolidated Balance Sheets (parenthetical)
Consolidated Statements Of Cash Flows
Consolidated Statements Of Changes In Equity
Consolidated Statements Of Changes In Equity (parenthetical)
Consolidated Statements Of Operations
Accrued Liabilities
Accrued Liabilities (detail)
Accrued Liabilities (tables)
Acquisitions
Acquisitions - Additional Information (detail)
Approximate Rental Expenses Under Operating Leases (detail)
Asset Impairments And Restructuring Charges
Asset Impairments And Restructuring Charges (tables)
Asset Impairments And Restructuring Charges - Additional Information (detail)
Assumptions Used To Estimate Fair Value Of Each Option Grant (detail)
Changes In Carrying Amount Of Deferred Financing Fees And Other Intangible Assets (detail)
Changes In Carrying Amount Of Goodwill For Company's Business Segments (detail)
Changes In Carrying Amount Of Senior Notes (detail)
Commitments And Contingencies
Commitments And Contingencies - Additional Information (detail)
Components Of Deferred Tax Assets And Liabilities (detail)
Components Of Earnings Before Income Tax Expense (detail)
Computation Of Net Income Per Common Share
Computation Of Net Income Per Common Share (tables)
Debt
Debt (tables)
Debt - Additional Information (detail)
Difference In Income Tax Provided And Amounts Determined By Applying Statutory Rate To Income Before Income Taxes (detail)
Employees' Defined Contribution Plan
Employees' Defined Contribution Plan - Additional Information (detail)
Estimated Aggregate Amortization Expenses For Deferred Financing Fees And Other Intangible Assets (detail)
Fair Value Measurements And Financial Instruments
Fair Value Measurements And Financial Instruments (tables)
Fair Value Measurements And Financial Instruments - Additional Information (detail)
Fair Value Of Assets And Liabilities Measured On A Recurring Basis (detail)
Fair Values Of Derivative Instruments Not Receiving Hedge Accounting Treatment (detail)
Future Minimum Annual Rentals, Excluding Percentage Rentals, Required Under Leases That Had Initial, Noncancelable Lease Terms Greater Than One Year (detail)
Gains And Losses On Derivative Instruments And Foreign Currency Transaction (detail)
Goodwill, Intangible Assets And Deferred Financing Fees
Goodwill, Intangible Assets And Deferred Financing Fees (tables)
Goodwill, Intangible Assets And Deferred Financing Fees - Additional Information (detail)
Gross Profit And Gross Profit Percentages By Significant Product Category (detail)
Income Taxes
Income Taxes (tables)
Income Taxes - Additional Information (detail)
Information On Segments And Reconciliation To Earnings Before Income Taxes (detail)
Leases
Leases (tables)
Provision For Income Tax (detail)
Receivables (detail)
Receivables, Net
Receivables, Net (tables)
Reconciliation Of Changes In Gross Balances Of Unrecognized Tax Benefits (detail)
Reconciliation Of Shares Used In Calculating Basic And Diluted Net Income Per Common Share (detail)
Restricted Shares And Options To Purchase Shares Of Class A Common Stock Which Were Excluded From The Computation Of Diluted Earnings Per Share (detail)
Sales And Sales Percentage By Significant Product Category (detail)
Schedule Ii - Valuation And Qualifying Accounts
Schedule Ii - Valuation And Qualifying Accounts (detail)
Segment Information
Segment Information (tables)
Segment Information - Additional Information (detail)
Shareholders' Equity - Additional Information (detail)
Significant Products
Significant Products (tables)
Stock Incentive Plan
Stock Incentive Plan (tables)
Stock Incentive Plan - Additional Information (detail)
Stockholders' Equity
Subsequent Events
Subsequent Events - Additional Information (detail)
Summary Of Company's Asset Impairments And Restructuring Charges (detail)
Summary Of Company's Restricted Stock Awards Activity (detail)
Summary Of Outstanding And Exercisable Options (detail)
Summary Of Significant Accounting Policies
Summary Of Significant Accounting Policies (policies)
Summary Of Significant Accounting Policies (tables)
Summary Of Significant Accounting Policies - Additional Information (detail)
Summary Of Status Of Company's Stock Options (detail)
Supplemental Cash Flow Information
Supplemental Cash Flow Information (detail)
Supplemental Cash Flow Information (tables)
Unaudited Quarterly Consolidated Statement Of Operations (detail)
Unaudited Quarterly Consolidated Statement Of Operations (parenthetical) (detail)
Unaudited Quarterly Financial Information
Unaudited Quarterly Financial Information (tables)
Vendor Arrangements
Vendor Arrangements - Additional Information (detail)
Ticker: GME
CIK: 1326380
Form Type: 10-K Annual Report
Accession Number: 0001193125-12-134615
Submitted to the SEC: Tue Mar 27 2012 5:09:09 PM EST
Accepted by the SEC: Tue Mar 27 2012
Period: Saturday, January 28, 2012
Industry: Retail Computer And Computer Software Stores
External Resources:
Stock Quote
Social Media
SEC.gov

Bookmark the Permalink:
https://last10k.com/sec-filings/gme/0001193125-12-134615.htm