Please wait while we load the requested 10-K report or click the link below:
https://last10k.com/sec-filings/report/1801170/000180117024000064/clov-20231231.htm
May 2024
April 2024
April 2024
April 2024
March 2024
January 2024
December 2023
December 2023
December 2023
November 2023
| Dollars in Millions | Q4'23 | Q4'22 | FY'23 | FY'22 | ||||||||||||||||||||||
| Insurance revenue | $ | 303.1 | $ | 270.3 | $ | 1,235.8 | $ | 1,084.9 | ||||||||||||||||||
| Non-Insurance revenue | 197.9 | 622.6 | 773.2 | 2,380.1 | ||||||||||||||||||||||
| Total revenue | 510.3 | 898.8 | 2,033.7 | 3,476.7 | ||||||||||||||||||||||
| Insurance MCR | 82.4 | % | 92.4 | % | 81.2 | % | 91.8 | % | ||||||||||||||||||
Non-Insurance MCR | 100.2 | 103.6 | 99.8 | 103.4 | ||||||||||||||||||||||
Salaries and benefits plus General and administrative expenses ("SG&A") (1) | $ | 109.9 | $ | 124.3 | $ | 444.7 | $ | 486.6 | ||||||||||||||||||
Adjusted Salaries and benefits plus General and administrative expenses ("Adjusted SG&A") (non-GAAP) (1)(2) | 81.4 | 84.5 | 302.0 | 312.5 | ||||||||||||||||||||||
| Net loss | (70.5) | (84.2) | (213.4) | (339.6) | ||||||||||||||||||||||
Adjusted EBITDA (non-GAAP) (2)(3) | (19.1) | (80.0) | (44.7) | (290.4) | ||||||||||||||||||||||
Please wait while we load the requested 10-K report or click the link below:
https://last10k.com/sec-filings/report/1801170/000180117024000064/clov-20231231.htm
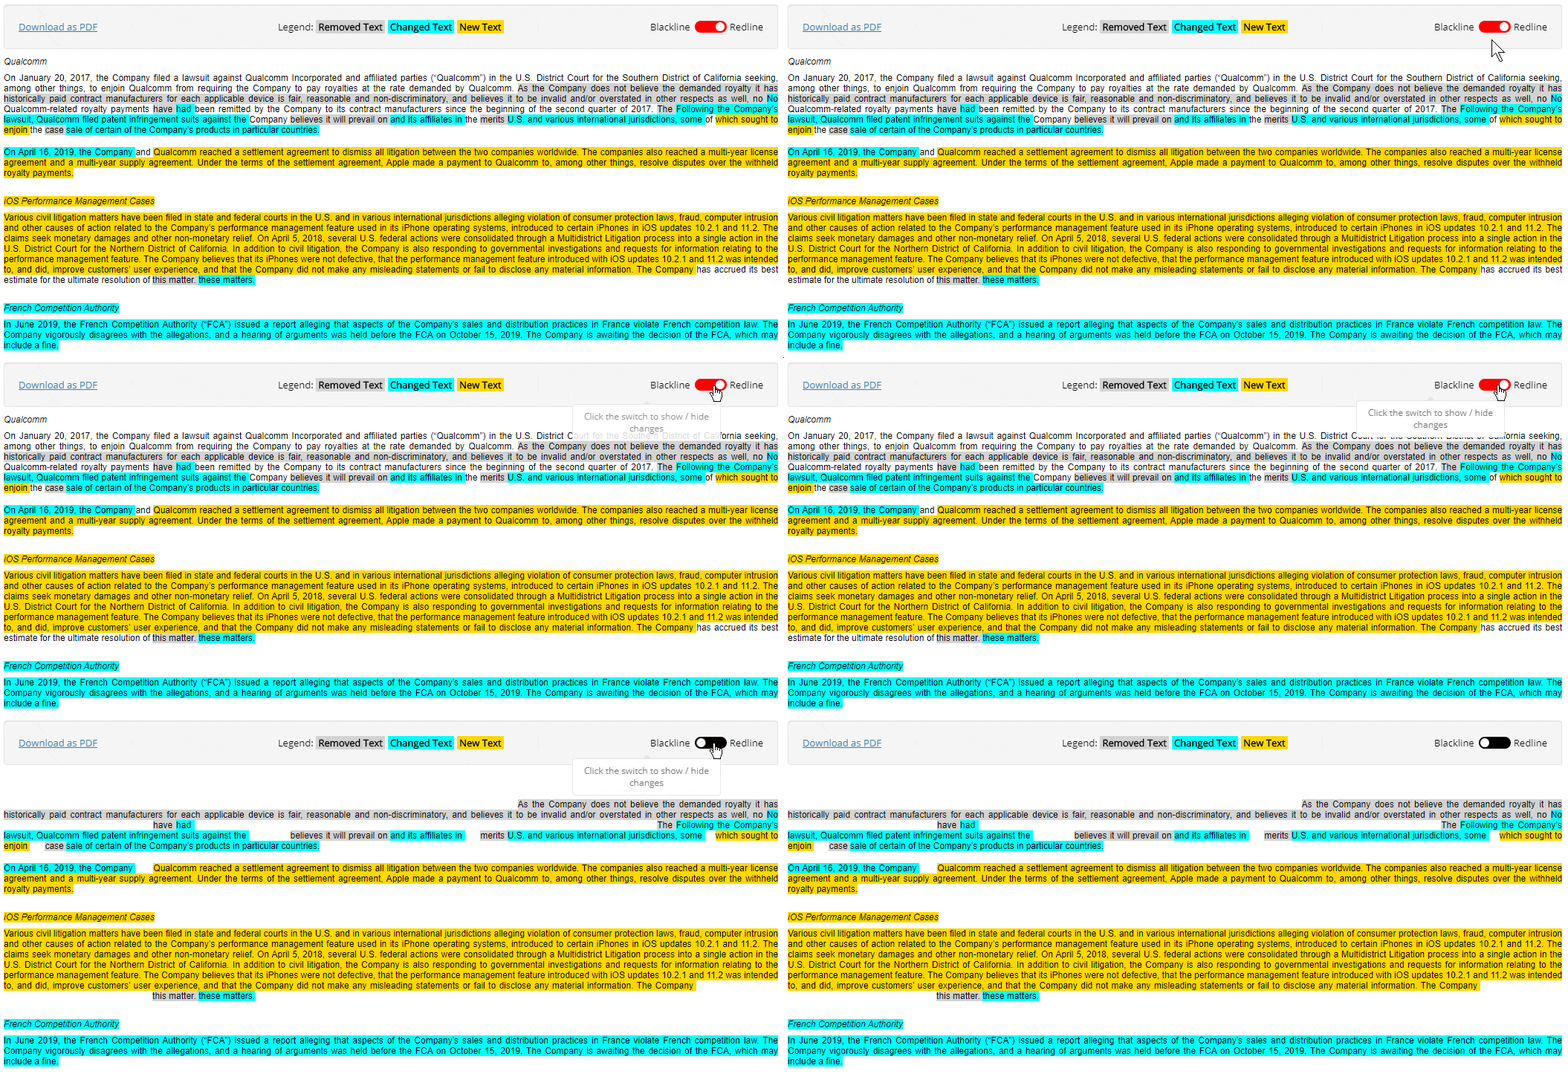
Compare this 10-K Annual Report to its predecessor by reading our highlights to see what text and tables were removed , added and changed by Clover Health Investments, Corp. De.
Clover Health Investments, Corp. De's Definitive Proxy Statement (Form DEF 14A) filed after their 2024 10-K Annual Report includes:
Rating
Learn More
Actual results could differ from those estimates under different assumptions or conditions, which could impact our reported results of operations and financial condition.
In addition, for more recent coverage periods we utilize historical estimates of completed claims to estimate the cost of subsequent months based on either expected or known changes in cost drivers.
The preliminary benchmark is set based on risk scores with data captured as of a certain point in time.
From time to time, we enter into reinsurance contracts to limit our exposure to potential losses as well as to provide additional capacity for growth.
If factors change and different assumptions are used, our stock-based compensation expense could be materially different in the future.
For the twelve months ended...Read more
Because our reserving practice is...Read more
For the twelve months ended...Read more
The grant date fair value...Read more
We continually adjust our completion...Read more
Premiums received in advance of...Read more
We believe these data-driven insights...Read more
Expected term - For Options...Read more
These variables include expected stock...Read more
Revenue from premiums earned is...Read more
Stock-based compensation costs for non-employees...Read more
The increase was primarily due...Read more
Premiums and recoupments incurred in...Read more
Premiums and recoupments incurred in...Read more
On April 17, 2023, the...Read more
On April 17, 2023, the...Read more
We believe the use of...Read more
Change in our working capital...Read more
The impairments are primarily related...Read more
Additionally, Non-Insurance net medical claims...Read more
Non-Insurance revenue represents CMS' total...Read more
Non-Insurance revenue represents CMS' total...Read more
Member months represents the number...Read more
The embedded derivatives associated with...Read more
Historically, we have financed our...Read more
We strongly believe in providing...Read more
We receive monthly premiums from...Read more
Non-Insurance revenue includes a direct...Read more
We seek to improve care...Read more
Payments due to CMS related...Read more
The measurement date for employee...Read more
Our cash requirements within the...Read more
These segment groupings are consistent...Read more
At December 31, 2023, we partnered...Read more
Through our Insurance segment, we...Read more
Premiums are earned in the...Read more
As a direct result of...Read more
Through our Insurance segment, we...Read more
(2) Defined as Insurance gross medical...Read more
We believe our MCR is...Read more
State insurance regulatory authorities that...Read more
This decrease was primarily driven...Read more
We manage our liquidity and...Read more
Stock-based compensation expense for such...Read more
We also set a lower...Read more
In February 2022, Character Biosciences...Read more
We base our estimates on...Read more
On July 22, 2021, we...Read more
Management estimates favorable adjustments to...Read more
We do not assess the...Read more
Once new data is received,...Read more
Management estimates and recognizes an...Read more
An evaluation of multiple scenarios...Read more
Our cash equivalents and investment...Read more
In conjunction with the Loan...Read more
The agreement with UST HealthProof...Read more
The agreement with UST HealthProof...Read more
We have also determined the...Read more
Premiums anticipated to be received...Read more
Our Non-Insurance segment consists of...Read more
We believe that the presentation...Read more
Expected volatility - We perform...Read more
Insurance net medical claims incurred...Read more
We believe Non-Insurance revenue provides...Read more
We make adjustments to the...Read more
Our regulated insurance subsidiaries have...Read more
We believe premiums earned, gross...Read more
Among other things, the longer...Read more
Non-Insurance revenue is also known...Read more
Non-Insurance revenue is also known...Read more
This technology is a cloud-based...Read more
Our primary uses of cash...Read more
As a result, $53.6 million...Read more
We evaluate, on an ongoing...Read more
These totals consist of $228.6...Read more
Risk scores are based on...Read more
Non-Insurance net medical claims incurred...Read more
The results form the basis...Read more
We assumed, in connection with...Read more
These reserves are required to...Read more
Estimated retroactive lump-sum settlement payments...Read more
CMS uses a risk-adjustment model...Read more
At December 31, 2022, the...Read more
Rebates are paid by drug...Read more
If a reserve is deemed...Read more
The September 2015 warrants and...Read more
There are key financial statement...Read more
Impairment of goodwill and other...Read more
Our strategy is to improve...Read more
Any future equity financing may...Read more
We extrapolate in order to...Read more
These data and trends include...Read more
The decrease was driven by...Read more
There have been no Market...Read more
On October 5, 2020, we...Read more
Non-Insurance revenue is calculated as...Read more
We continue to maintain significant...Read more
Non-Insurance revenue is the sum...Read more
In connection with the redemption,...Read more
In September 2015, we issued...Read more
Pursuant to CMS’s Medicare Advantage...Read more
Management's Discussion and Analysis of...Read more
(2) Defined as Non-Insurance net...Read more
The Company’s exit from the...Read more
The Company’s exit from the...Read more
We assess the profitability of...Read more
We receive premiums from CMS...Read more
As part of our Non-Insurance...Read more
Beginning in 2024, our MA...Read more
We begin our benchmark estimation...Read more
Premiums earned, net represents the...Read more
We calculate our MCR by...Read more
Any known or expected unfavorable...Read more
Such methodologies included reviewing values...Read more
Insurance regulators have broad powers...Read more
We believe that funds from...Read more
Ceded earned premiums are earned...Read more
As such, we may receive...Read more
Our actuaries also consider this...Read more
Our future capital requirements will...Read more
A premium deficiency reserve is...Read more
We do not have any...Read more
Our Non-Insurance segment consists of...Read more
At Clover Health, our vision...Read more
A $7.2 million premium deficiency...Read more
Additionally, our regulated insurance subsidiaries...Read more
For the year ended December...Read more
Under this approach, we include...Read more
We may be required to...Read more
On January 5, 2024, CMS...Read more
Key metrics considered for insurance...Read more
CMS released the Company’s 2024...Read more
Management records a receivable or...Read more
Management's Discussion and Analysis of...Read more
These private warrants were accounted...Read more
The expected future investment returns...Read more
Our proprietary software platform, Clover...Read more
These commitments are associated with...Read more
We measure and recognize compensation...Read more
The PAD is lower for...Read more
Net cash provided by investing...Read more
On December 1, 2023, the...Read more
On December 1, 2023, the...Read more
On December 1, 2023, the...Read more
We continually forecast and manage...Read more
In accordance with ASC 323,...Read more
We expect the cash required...Read more
We enter into reinsurance contracts...Read more
Net cash provided by investing...Read more
In the calendar year 2024,...Read more
Our use of operating cash...Read more
There were no other material...Read more
For the fourth quarter, assessments...Read more
There have been no material...Read more
Payments due to CMS related...Read more
Premiums earned, gross is the...Read more
The risk corridor provisions compare...Read more
We view our number of...Read more
Key inputs considered for premiums...Read more
Derivatives embedded within non-derivative instruments,...Read more
We recognize stock-based compensation expense...Read more
A beneficiary alignment is effective...Read more
That reserve will be amortized...Read more
The Public Warrants were classified...Read more
At December 31, 2023, we operated...Read more
Among plans with similar major...Read more
Under the risk-adjustment methodology, all...Read more
Insurance gross medical claims incurred...Read more
These cost drivers include weekday...Read more
The grant date fair value...Read more
These warrants were accounted for...Read more
Stock-based compensation expense is classified...Read more
At December 31, 2023 and 2022,...Read more
Prospective payments to MA plans...Read more
Cash, cash equivalents, and investments...Read more
The reserve is derived from...Read more
The warrant assets are measured...Read more
The most significant of financial...Read more
This represents a 0.5 Star...Read more
The volume of our ceded...Read more
Under these agreements, the "reinsurer,"...Read more
The grant date fair value...Read more
The grant date fair value...Read more
For the year ended December...Read more
We believe our MCR is...Read more
These expenses generally vary based...Read more
Performance year receivable and obligation...Read more
For the year ended December...Read more
The fair value of each...Read more
At December 31, 2023 and December 31,...Read more
Estimates are based on both...Read more
These factors are used to...Read more
Our reserving practice is to...Read more
Variances exceeding certain thresholds may...Read more
These private warrants were classified...Read more
Management estimates and recognizes adjustments...Read more
We expect that our cash,...Read more
We believe gross medical claims...Read more
We calculate our medical care...Read more
Administrative expenses are assessed for...Read more
There are additional cost-sharing elements...Read more
The fair value of each...Read more
Our unregulated subsidiaries held $62.8...Read more
For both of the Company's...Read more
The warrant liabilities are measured...Read more
Beneficiary months represents the number...Read more
* Not presented because the current...Read more
Lastly, Non-Insurance Beneficiary counts are...Read more
We believe that the accounting...Read more
We evaluated the embedded features...Read more
The amortization of the reserve...Read more
Non-Insurance revenue includes a direct...Read more
Actuarial standards require the use...Read more
Non-cash activities included a $140.9...Read more
Actuarial standards require the use...Read more
The Private Placement Warrants were...Read more
Insurance net medical claims incurred...Read more
If we are unable to...Read more
At December 31, 2023 and December 31,...Read more
There are other operating activities...Read more
The determination of the grant-date...Read more
The measurement date for non-employee...Read more
The key inputs in determining...Read more
Completion factors are applied to...Read more
Fair values of the Legacy...Read more
In addition to the arrangement...Read more
In addition to the arrangement...Read more
Non-Insurance net medical claims incurred...Read more
The period-to-period comparison of results...Read more
Financial Statements, Disclosures and Schedules
Inside this 10-K Annual Report
Material Contracts, Statements, Certifications & more
Clover Health Investments, Corp. De provided additional information to their SEC Filing as exhibits
Ticker: CLOV
CIK: 1801170
Form Type: 10-K Annual Report
Accession Number: 0001801170-24-000064
Submitted to the SEC: Thu Mar 14 2024 7:24:35 AM EST
Accepted by the SEC: Thu Mar 14 2024
Period: Sunday, December 31, 2023
Industry: Hospital And Medical Service Plans

