Please wait while we load the requested 10-Q report or click the link below:
https://last10k.com/sec-filings/report/1543151/000154315119000017/fy2019q3financialstate.htm
February 2024
February 2024
November 2023
November 2023
November 2023
November 2023
September 2023
August 2023
June 2023
May 2023
• | Gross Bookings grew $3.7 billion year-over-year to $16.5 billion, representing 29% year-over-year growth, or 32% on a constant currency basis. |
• | Revenue growth accelerated to 30% year-over-year from 14% in the second quarter of 2019. |
• | Adjusted Net Revenue (“ANR”) growth accelerated to 33% year-over-year, or 35% on a constant currency basis as both Rides and Eats ANR take-rates improved quarter-over-quarter to 22.8% and 10.7%, respectively. |
• | Net loss attributable to Uber Technologies, Inc. of $(1.2) billion, which includes $401 million in stock-based compensation expense, improved quarter-over-quarter in part due to revenue growth of $647 million. |
• | Rides Adjusted EBITDA of $631 million was the Rides segment’s 8th positive Adjusted EBITDA quarter in a row and covered our Corporate G&A and Platform R&D of $623 million. |
• | Adjusted EBITDA of $(585) million improved $71 million quarter-over-quarter. |
• | Unrestricted cash and cash equivalents were $12.7 billion, which was up $0.9 billion from the second quarter of 2019 primarily due to the sale of $1.2 billion of senior unsecured notes and the closing of the $1.0 billion investment in ATG. |
Three Months Ended September 30, | ||||||||||||||
(in millions, except percentages) | 2018 | 2019 | % Change | % Change (Constant Currency (1)) | ||||||||||
Monthly Active Platform Consumers (“MAPCs”) | 82 | 103 | 26 | % | ||||||||||
Trips | 1,348 | 1,770 | 31 | % | ||||||||||
Gross Bookings | $ | 12,725 | $ | 16,465 | 29 | % | 32 | % | ||||||
Revenue | $ | 2,944 | $ | 3,813 | 30 | % | 31 | % | ||||||
Adjusted Net Revenue (1) | $ | 2,656 | $ | 3,533 | 33 | % | 35 | % | ||||||
Net loss attributable to Uber Technologies, Inc. (2) | $ | (986 | ) | $ | (1,162 | ) | (18 | )% | ||||||
Adjusted EBITDA (1) | $ | (458 | ) | $ | (585 | ) | (28 | )% | ||||||
Please wait while we load the requested 10-Q report or click the link below:
https://last10k.com/sec-filings/report/1543151/000154315119000017/fy2019q3financialstate.htm
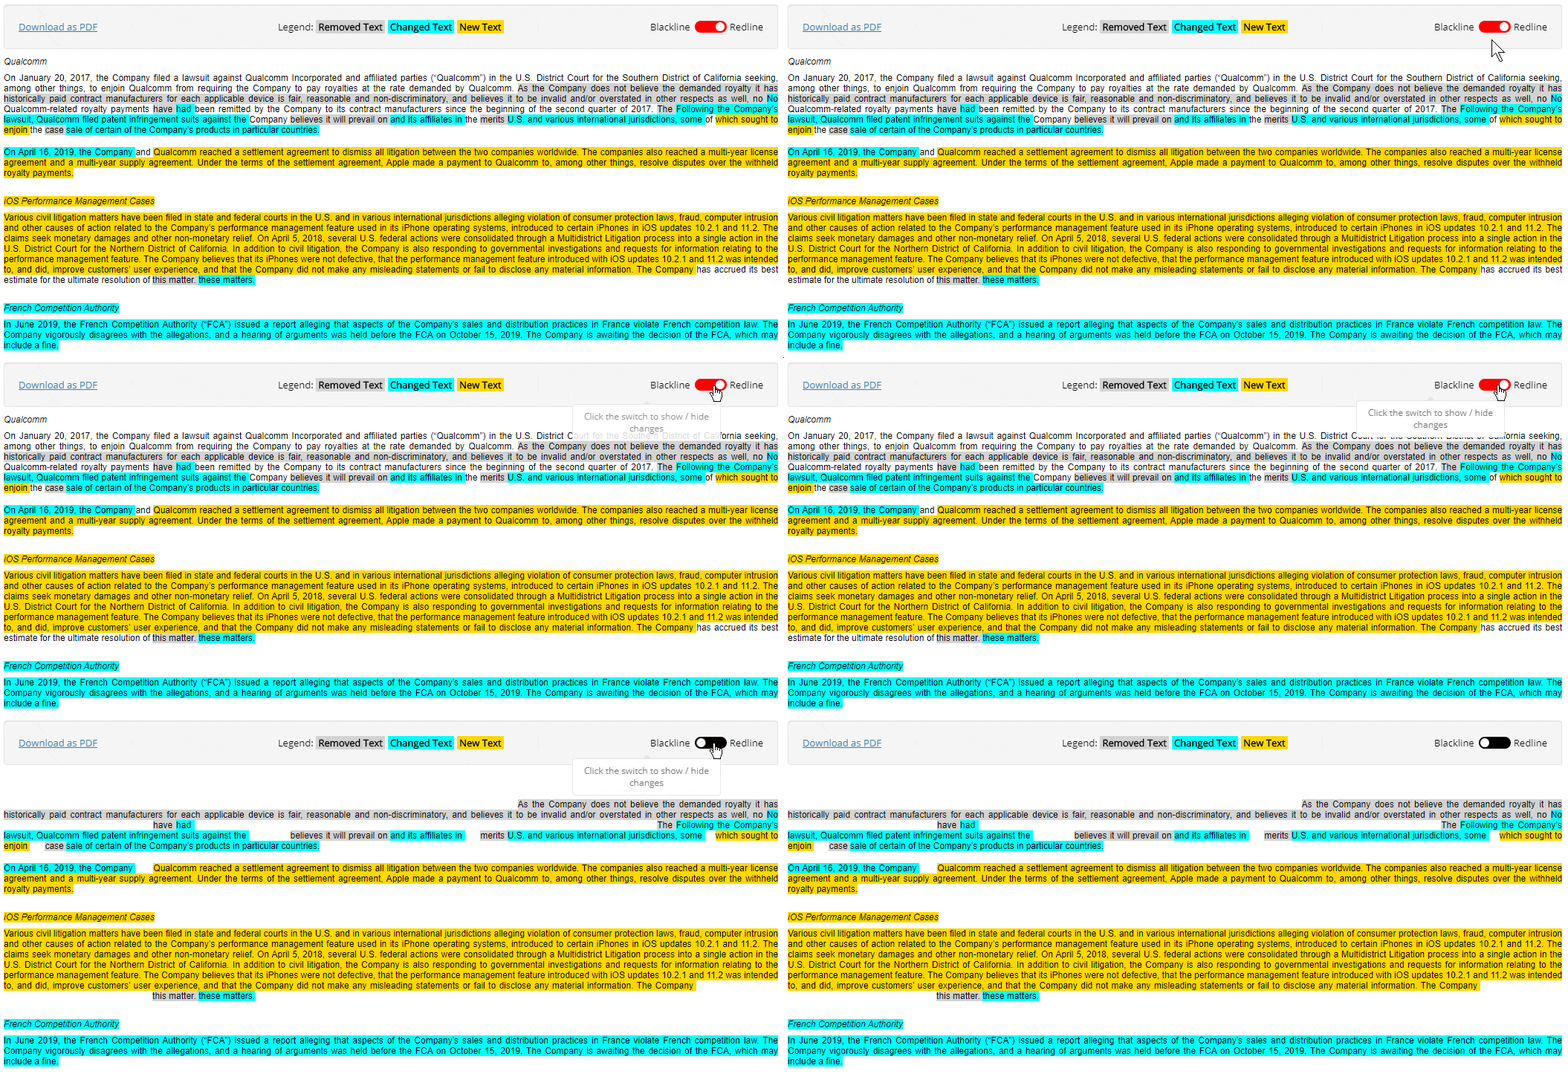
Compare this 10-Q Quarterly Report to its predecessor by reading our highlights to see what text and tables were removed , added and changed by Uber Technologies, Inc.
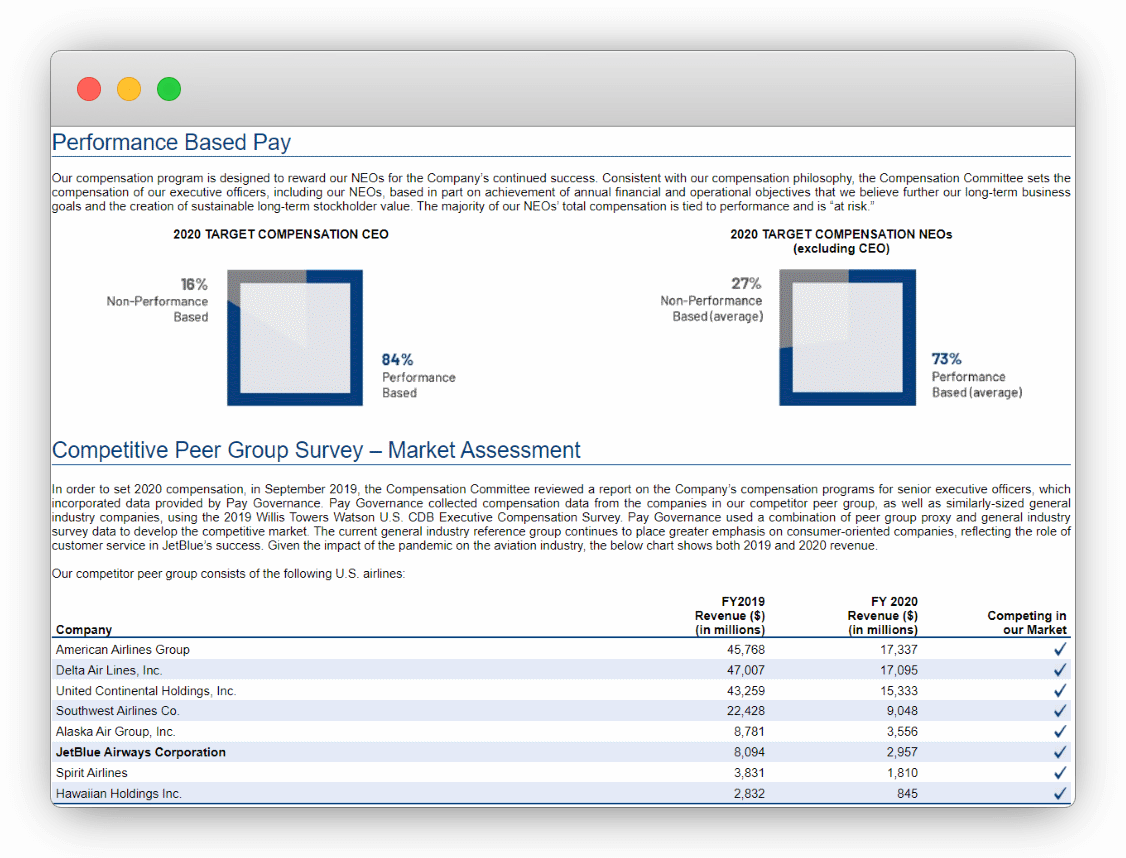
Uber Technologies, Inc's Definitive Proxy Statement (Form DEF 14A) filed after their 2019 10-K Annual Report includes:
Rating
Learn More
General and administrative expenses increased $1.1 billion, or 74%, primarily attributable to an increase in employee headcount costs, stock-based compensation related to RSUs with a performance condition satisfied upon our IPO registration statement, and legal, tax, and regulatory reserve changes and settlements expenses.
Interest income increased by $49 million or 181% primarily due to interest income earned on higher average cash balances from the proceeds of our IPO.
Interest income increased by $115 million or 167% primarily due to interest income earned on higher average cash balances from the proceeds of our IPO and additional investment from our ATG investors.
Depreciation and amortization expenses decreased $29 million, or 22%, primarily attributable to computer equipment and leasehold improvements.
Net cash used in operating activities was $860 million for the nine months ended September 30, 2018, primarily consisting of $1.9 billion of net income, adjusted for certain non-cash items, which primarily included a $3.2 billion gain on business divestitures related to our 2018 Divested Operations, gain on debt and equity securities, net of $2.0 billion related to our investment in Didi, $420 million change in deferred income taxes, $491 million of revaluation expense of our derivative liabilities, depreciation and amortization expense of $317 million, $231 million in accretion of discount on our long-term debt, and $145 million of stock-based compensation expense, as well as an $638 million decrease in cash consumed by working capital primarily driven by an increase in our insurance reserves and accrued expenses, partially offset by and higher accounts receivable and prepaid expenses.
Net cash provided by financing...Read more
Net cash used in operating...Read more
Operations and support expenses increased...Read more
Loss from equity method investment,...Read more
General and administrative expenses increased...Read more
For more information about how...Read more
Cost of revenue, exclusive of...Read more
Cost of revenue, exclusive of...Read more
Three Months Ended September 30,...Read more
The following tables present reconciliations...Read more
For the three months ended...Read more
For the nine months ended...Read more
In the third quarter of...Read more
Rides Adjusted EBITDA profitability now...Read more
Operations and support expenses increased...Read more
Research and development expenses increased...Read more
Income tax expense decreased by...Read more
Depreciation and amortization expenses increased...Read more
These increases were partially offset...Read more
Net cash provided by financing...Read more
In addition to revenue, net...Read more
Adjusted Net Revenue and Adjusted...Read more
Gain (loss) on debt and...Read more
Depreciation includes expenses associated with...Read more
The table above also excludes...Read more
Notice of Cancellation of Insurance...Read more
We expect that depreciation and...Read more
Cost of revenue, exclusive of...Read more
56 For the three months...Read more
53 Interest expense decreased by...Read more
Based on available objective evidence,...Read more
Adjusted EBITDA has limitations as...Read more
Accordingly, we believe that Adjusted...Read more
For the three months ended...Read more
For the nine months ended...Read more
Gain (loss) on debt and...Read more
As trips increase, we expect...Read more
Sales and marketing expenses increased...Read more
Adjusted Net Revenue increased $877...Read more
While adjusted EBITDA loss increased...Read more
Including $17 million collaboration revenue...Read more
Including $17 million collaboration revenue...Read more
We expect that operations and...Read more
Freight adjusted net revenue increased...Read more
Freight adjusted net revenue increased...Read more
For a discussion of risk...Read more
Gain on extinguishment of convertible...Read more
Other decreased by $41 million...Read more
The redomiciliation resulted in a...Read more
Our calculation of these non-GAAP...Read more
Rides adjusted net revenue increased...Read more
ATG and Other Technology Programs...Read more
Eats adjusted net revenue increased...Read more
Gain (loss) on debt and...Read more
Accordingly, we believe that these...Read more
Income tax expense increased by...Read more
Rides adjusted EBITDA profit increased...Read more
Interest expense increased by $5...Read more
To the extent we are...Read more
These increases were partially offset...Read more
57 Other Bets adjusted net...Read more
Other Bets adjusted net revenue...Read more
Revenue increased $869 million, or...Read more
51 Revenue increased $1.8 billion,...Read more
Gain on business divestitures, which...Read more
See the section titled "Reconciliations...Read more
Foreign currency exchange gains (losses),...Read more
54 Foreign currency exchange gains...Read more
ATG and Other Technology Programs...Read more
Sales and marketing expenses increased...Read more
The following discussion and analysis...Read more
We also believe that our...Read more
Segment Adjusted EBITDA is defined...Read more
We define Adjusted EBITDA as...Read more
As of September 30, 2019,...Read more
The trend and timing of...Read more
For the nine months ended...Read more
We expect that cost of...Read more
Gain on extinguishment of convertible...Read more
See the section titled "Reconciliations...Read more
See the section titled "Reconciliations...Read more
See the section titled "Reconciliations...Read more
We expect that research and...Read more
Financial Statements, Disclosures and Schedules
Inside this 10-Q Quarterly Report
Material Contracts, Statements, Certifications & more
Uber Technologies, Inc provided additional information to their SEC Filing as exhibits
Ticker: UBER
CIK: 1543151
Form Type: 10-Q Quarterly Report
Accession Number: 0001543151-19-000017
Submitted to the SEC: Tue Nov 05 2019 11:58:34 AM EST
Accepted by the SEC: Tue Nov 05 2019
Period: Monday, September 30, 2019
Industry: Prepackaged Software

