Please wait while we load the requested 10-Q report or click the link below:
https://last10k.com/sec-filings/report/1490349/000149034918000033/medleycapitalcorpjune30201.htm
December 2020
December 2020
November 2020
October 2020
October 2020
September 2020
August 2020
August 2020
August 2020
July 2020
• | Net asset value (“NAV”) of $6.43 per share |
• | Declared a dividend of $0.10 per share |
• | Net investment income of $0.02 per share |
• | Legacy Assets declined from 20.4% to 10.9% |
Please wait while we load the requested 10-Q report or click the link below:
https://last10k.com/sec-filings/report/1490349/000149034918000033/medleycapitalcorpjune30201.htm
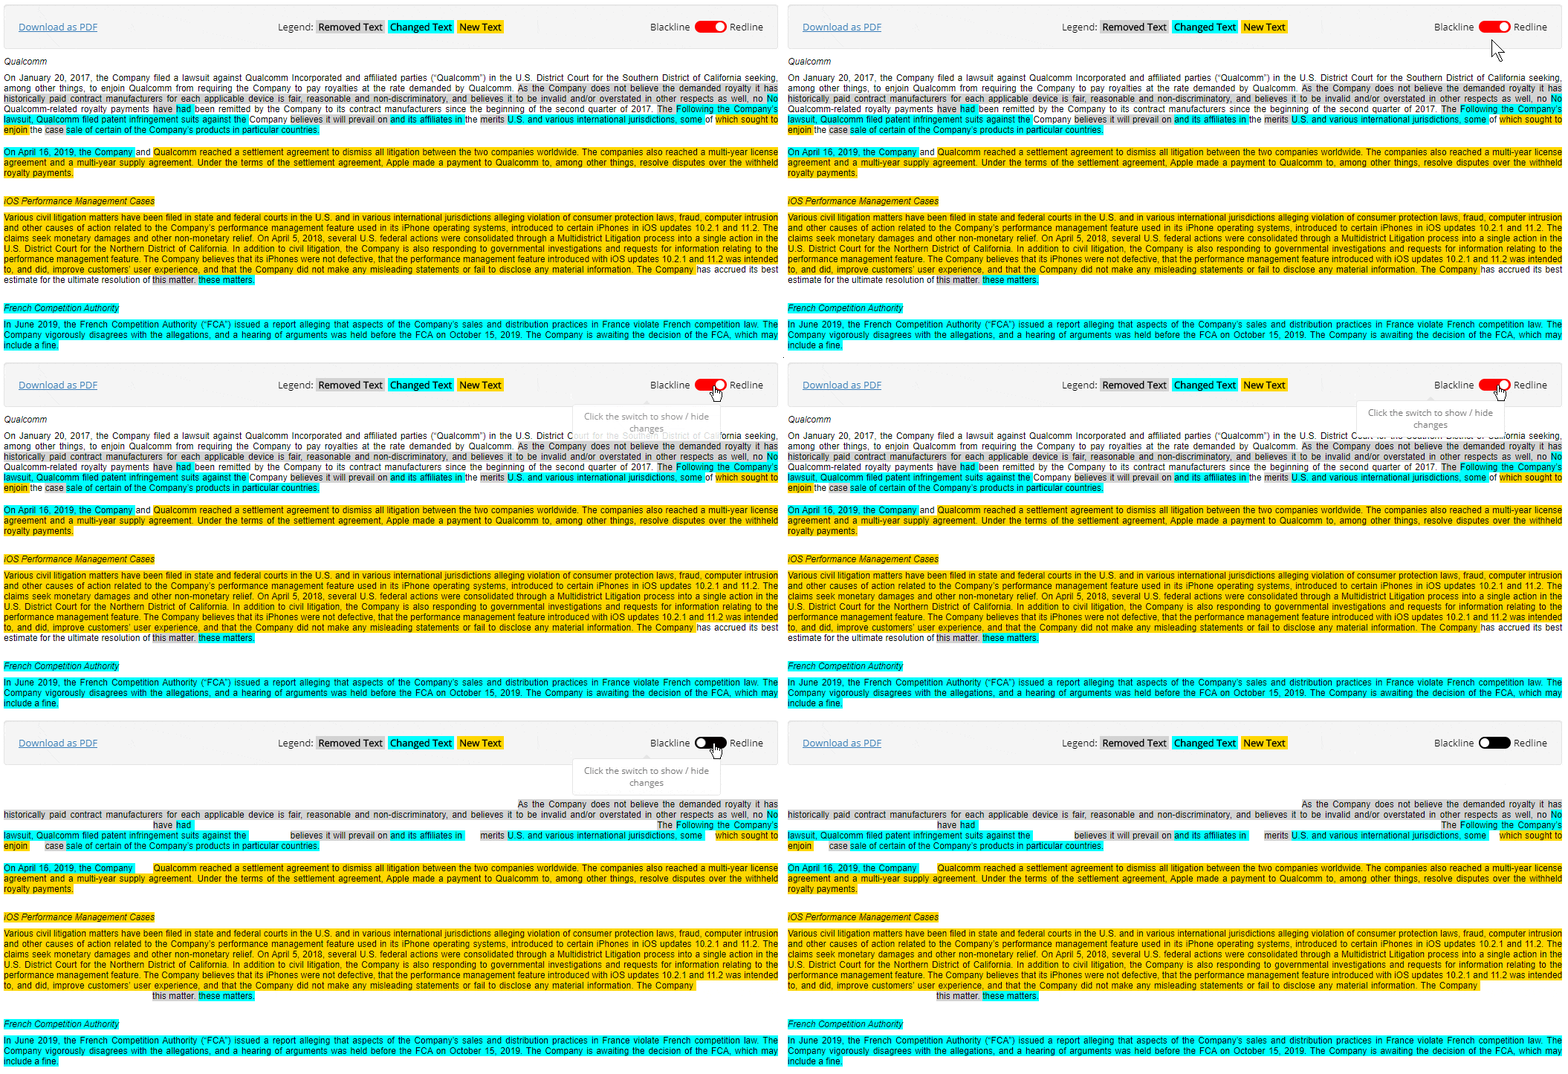
Compare this 10-Q Quarterly Report to its predecessor by reading our highlights to see what text and tables were removed , added and changed by Medley Capital Corp.
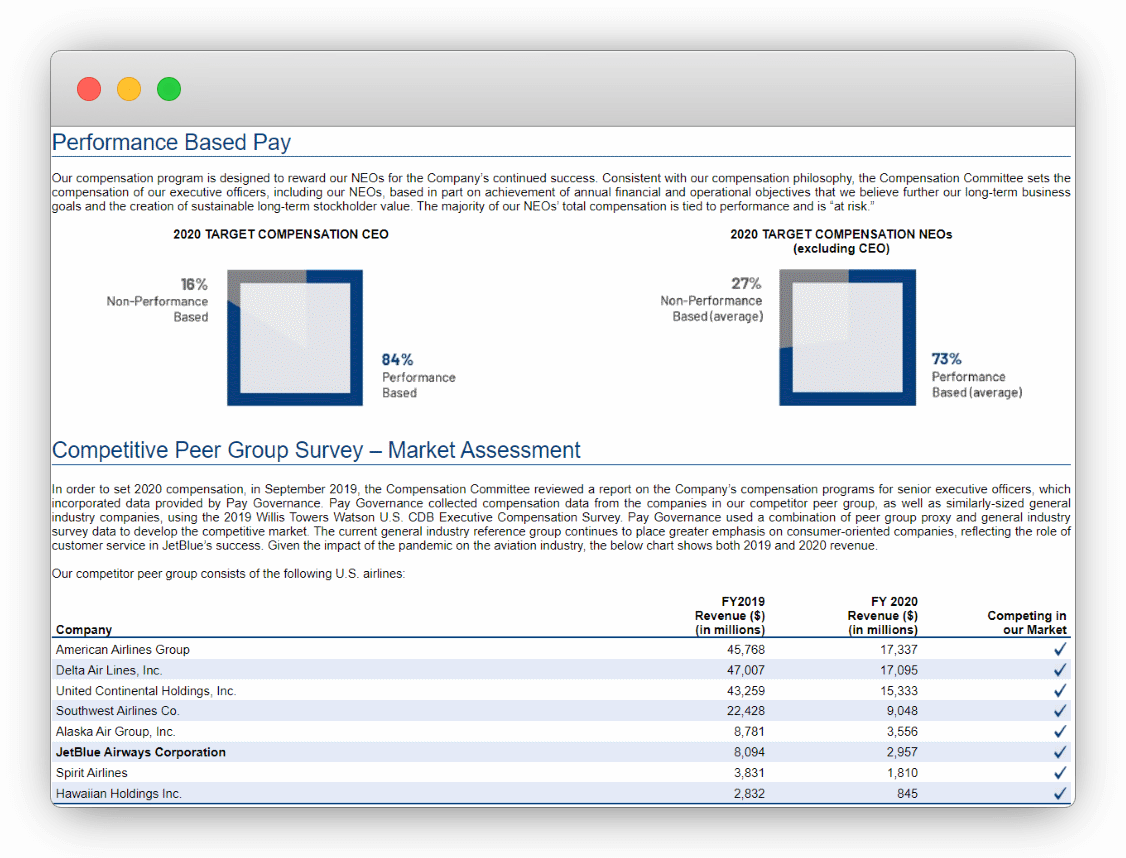
Medley Capital Corp's Definitive Proxy Statement (Form DEF 14A) filed after their 2018 10-K Annual Report includes:
Rating
Learn More
The reduction was accounted for as a debt modification to a line-of credit or revolving-debt arrangement in accordance with ASC 470-50, Modifications and Extinguishments, which attributed to an acceleration of debt issuance costs in the amount of $1.3 million and recorded on the Consolidated Statements of Operations as a component of interest and financing expenses.
The reduction was accounted for as a debt modification to a line-of credit or revolving-debt arrangement in accordance with ASC 470-50, Modifications and Extinguishments, which attributed to an acceleration of debt issuance costs in the amount of $0.4 million and recorded on the Consolidated Statements of Operations as a component of interest and financing expenses.
If, in any quarter, the Incentive Fee Cap for such quarter is equal to or greater than the incentive fee on net investment income that is payable to MCC Advisors for such quarter before giving effect to the Incentive Fee Cap calculated as described above, the Company will pay an incentive fee on net investment income to MCC Advisors, calculated as described above, for such quarter without regard to the Incentive Fee Cap.
If, in any quarter, the Incentive Fee Cap for such quarter is a positive value but is less than the incentive fee on net investment income that is payable to MCC Advisors for such quarter before giving effect to the Incentive Fee Cap calculated as described above, the Company will pay an incentive fee on net investment income to MCC Advisors equal to the Incentive Fee Cap for such quarter.
The amount of the incentive fee on net investment income that will be paid to MCC Advisors for a particular quarter will equal the excess of the incentive fee so calculated minus the aggregate incentive fees on net investment income that were paid in respect of the first eleven calendar quarters or the portion thereof included in the relevant Trailing Twelve Quarters but not in excess of the Incentive Fee Cap as described below.
As the provisional capital gains...Read more
Occasionally, we receive warrants or...Read more
compared to a per share...Read more
The second component of the...Read more
Execution of the repurchase plan...Read more
primarily due to an increase...Read more
primarily due to an increase...Read more
Our liquidity and capital resources...Read more
The investment management agreement became...Read more
at least 98.2 percent of...Read more
In addition, the inability to...Read more
Concurrent with the pricing of...Read more
The administration agreement became effective...Read more
The terms of the Fee...Read more
In the future, we may...Read more
In addition, we are only...Read more
To the extent that the...Read more
The base management fee is...Read more
We may choose to retain...Read more
MCC Advisors services under the...Read more
Under the share repurchase program,...Read more
On December 12, 2016, the...Read more
The notes to our financial...Read more
On August 2, 2018, the...Read more
and will decrease by an...Read more
changes in political, economic or...Read more
The Incentive Fee Cap for...Read more
The 2024 Notes will mature...Read more
compared to a net increase...Read more
Material Contracts, Statements, Certifications & more
Medley Capital Corp provided additional information to their SEC Filing as exhibits
Ticker: MCC
CIK: 1490349
Form Type: 10-Q Quarterly Report
Accession Number: 0001490349-18-000033
Submitted to the SEC: Thu Aug 09 2018 5:24:46 PM EST
Accepted by the SEC: Thu Aug 09 2018
Period: Saturday, June 30, 2018
Industry: 1490349

