Please wait while we load the requested 10-Q report or click the link below:
https://last10k.com/sec-filings/report/1109354/000110465918067274/a18-19026_110q.htm
April 2024
April 2024
February 2024
February 2024
February 2024
January 2024
January 2024
December 2023
November 2023
August 2023

Bruker Reports Third Quarter 2018 Financial Results
BILLERICA, Mass. — November 1, 2018 — Bruker Corporation (NASDAQ: BRKR) today announced financial results for its third quarter and nine months ended September 30, 2018.
Bruker’s revenues for the third quarter of 2018 were $466.6 million, an increase of 7.1% compared to the third quarter of 2017. In the third quarter of 2018, Bruker’s year-over-year organic revenue growth was 7.0%. Growth from acquisitions was 1.5%, while foreign currency translation had a negative effect of 1.4%.
Third quarter 2018 Bruker Scientific Instruments (BSI) segment revenues of $417.1 million increased 6.8%, compared to the third quarter of 2017, including organic growth of 6.5%. Third quarter 2018 BEST segment revenues of $50.9 million increased 10.4%, compared to the third quarter of 2017, including organic growth, net of intercompany eliminations, of 11.1%.
Third quarter 2018 GAAP operating income was $69.1 million, compared to $51.3 million in the third quarter of 2017. Non-GAAP operating income was $83.3 million, compared to $65.8 million in the third quarter of 2017. On a non-GAAP basis, Bruker’s third quarter 2018 operating margin of 17.9% increased 280 basis points compared to 15.1% in the third quarter of 2017. Strong operating leverage, favorable product mix and operational improvements contributed to the year-over-year margin increase.
Third quarter 2018 GAAP diluted earnings per share (EPS) were $0.28, an increase of 21.7% compared to $0.23 in the third quarter of 2017. Third quarter 2018 non-GAAP diluted EPS were $0.37, an increase of 27.6% compared to $0.29 in the third quarter of 2017.
For the first nine months of 2018, Bruker’s revenues increased 8.6% to $1,342.0 million, from $1,235.4 million in the first nine months of 2017. In the first nine months of 2018, Bruker’s year-over-year organic revenue growth was 4.7%. Favorable foreign currency translation contributed 3.0% to revenue growth, while growth from acquisitions was 0.9%.
In the first nine months of 2018, BSI segment revenues of $1,206.5 million increased 9.7%, compared to the first nine months of 2017, including organic growth of 5.8%. BEST segment revenues in the first nine months of 2018 of $139.2 million declined 0.7%, compared to the first nine months of 2017, including an organic decline, net of intercompany eliminations, of 4.8%.
In the first nine months of 2018, GAAP operating income was $156.0 million, compared to $124.2 million in the first nine months of 2017. Non-GAAP operating income was $195.1 million, compared to $168.5 million in the first nine months of 2017. On a non-GAAP basis, Bruker’s operating margin in the first nine months of 2018 of 14.5% increased 90 basis points, compared to 13.6% in the first nine months of 2017. During the first nine months of 2018, volume leverage and operational improvements more than offset a strong unfavorable impact from changes in foreign currency rates on operating margins, which occurred primarily in the first half of the year.
In the first nine months of 2018, GAAP EPS were $0.65, an increase of 27.5% compared to $0.51 in the first nine months of 2017. Non-GAAP EPS for the first nine months of 2018 were $0.86, an increase of 22.9% over $0.70 in the first nine months of 2017.
A reconciliation of non-GAAP to GAAP financial measures is provided in the tables accompanying this press release.
Please wait while we load the requested 10-Q report or click the link below:
https://last10k.com/sec-filings/report/1109354/000110465918067274/a18-19026_110q.htm
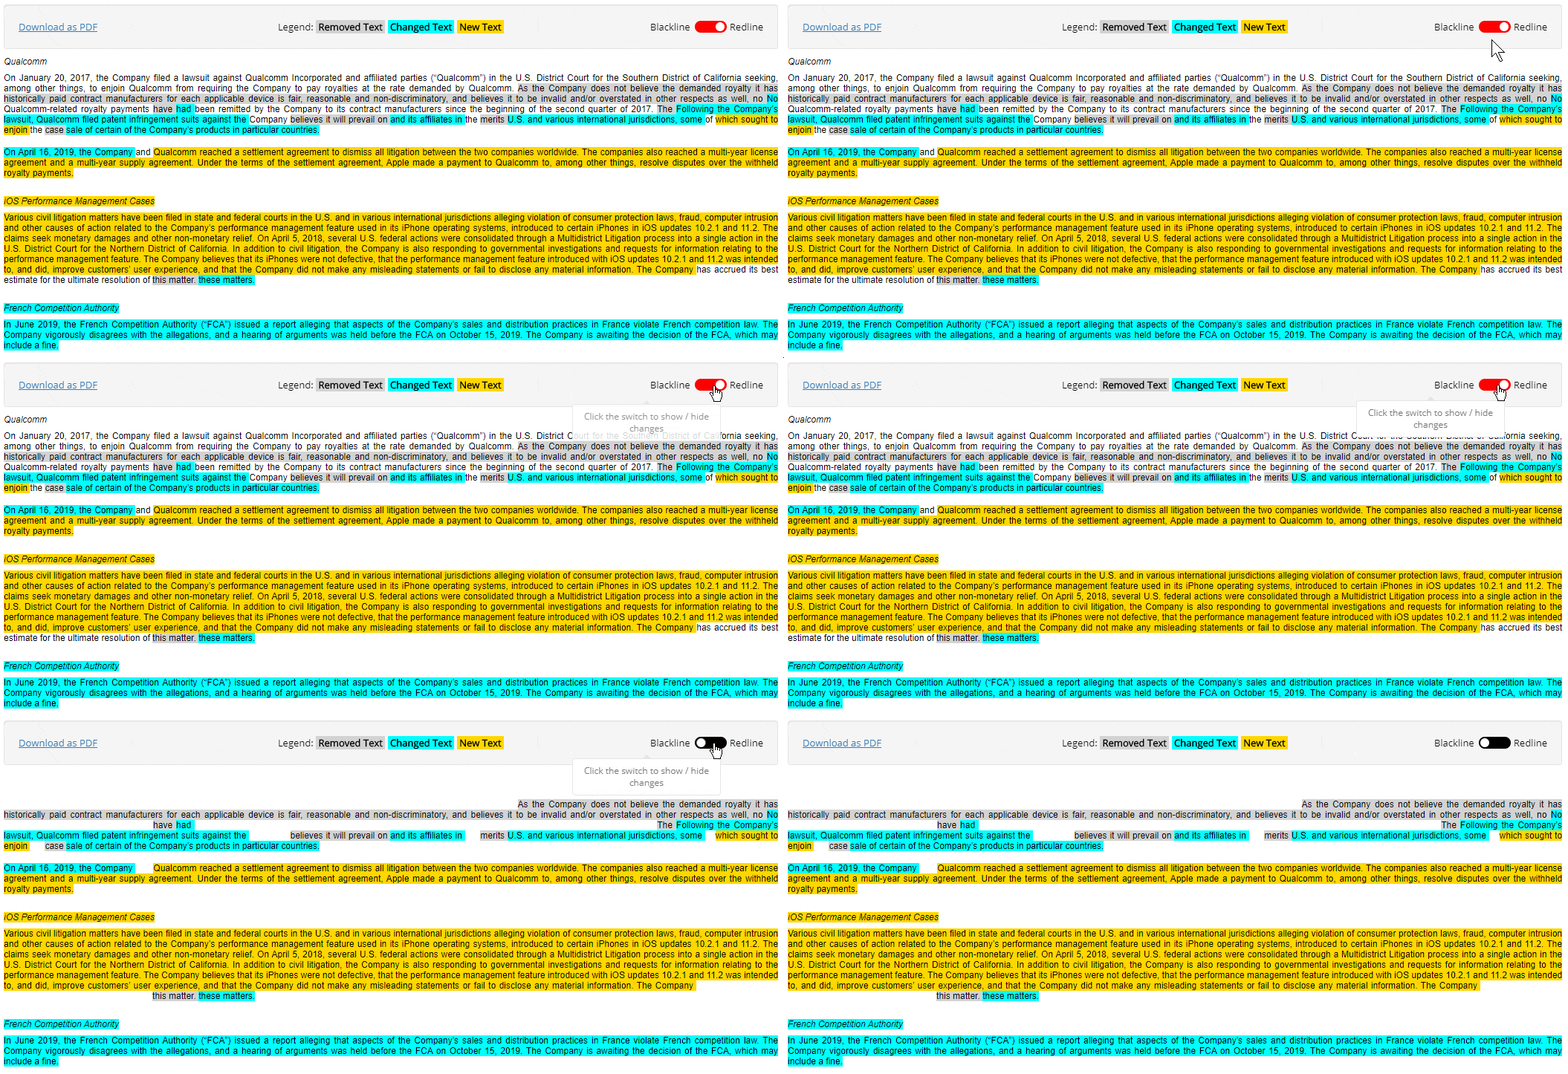
Compare this 10-Q Quarterly Report to its predecessor by reading our highlights to see what text and tables were removed , added and changed by Bruker Corp.
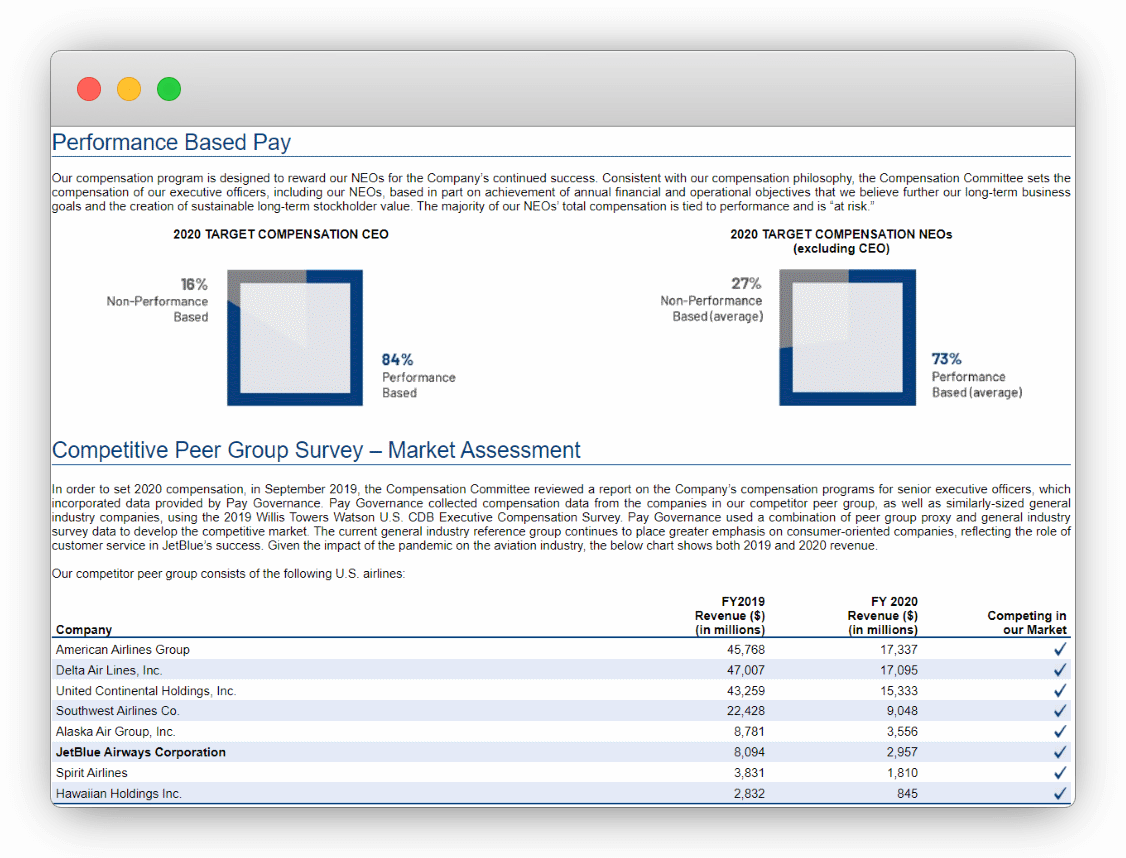
Bruker Corp's Definitive Proxy Statement (Form DEF 14A) filed after their 2018 10-K Annual Report includes:
Rating
Learn More
The increase in net income and earnings per diluted share was primarily driven by the increase in revenue and significant year-over-year margin improvements.
The increase in gross profit margin resulted primarily from growth in revenue, favorable product mix and the impact of operational improvements.
The increase in gross profit margin in both periods resulted primarily from strong operating leverage, favorable product mix and the impact of operational improvements.
The increase in our GAAP and non-GAAP operating margins was primarily due to the favorable impact of higher revenue and operational improvements, partially offset by unfavorable foreign currency translation.
The operating margin expansion was primarily due to the favorable impact of higher volumes and operational improvements.
The operating margin expansion was...Read more
GAAP and non-GAAP operating margin...Read more
Operating income included $14.1 million...Read more
Operating income included $38.7 million...Read more
These non-GAAP measures exclude costs...Read more
System and wire revenue and...Read more
Included in gross profit were...Read more
Included in operating income were...Read more
Operating income included $0.1 million...Read more
Included in gross profit were...Read more
Included in operating income were...Read more
Operating income included $0.4 million...Read more
GAAP and non-GAAP operating margins...Read more
In May 2017, our Board...Read more
Our gross profit margin increased...Read more
Additional Chinese tariffs could potentially...Read more
Our gross profit margin increased...Read more
As of September 30, 2018,...Read more
BEST Segment operating income increased...Read more
BEST Segment operating income increased...Read more
The Bruker CALID Group revenue...Read more
RECENT ACCOUNTING PRONOUNCEMENTS In March...Read more
Nine Months Ended September 30,...Read more
BEST Segment gross margin increased...Read more
RESULTS OF OPERATIONS Three Months...Read more
The Bruker CALID Group revenue...Read more
Although our unaudited condensed consolidated...Read more
The increase in gross profit...Read more
Service revenue is recognized as...Read more
Our operating margin increased to...Read more
This was offset by $27.5...Read more
Our operating margin increased to...Read more
BEST Segment gross margin increased...Read more
Earnings per share increased from...Read more
Diluted earnings per share for...Read more
In particular, we have certain...Read more
From a geographic perspective, for...Read more
For systems that require installation...Read more
34 The Bruker BioSpin Group...Read more
The Bruker BioSpin Group revenue...Read more
Contract assets typically result from...Read more
Revenue includes approximately $6.4 million...Read more
The Bruker Nano Group revenue...Read more
The Bruker Nano Group revenue...Read more
Included in revenue was an...Read more
The key elements of ASC...Read more
Reportable Segment Revenue The following...Read more
Reportable Segment Revenue The following...Read more
System and wire revenue and...Read more
Strong demand for mass spectrometry...Read more
During the nine months ended...Read more
Contract Assets and Liabilities Contract...Read more
The mix of earnings in...Read more
The mix of earnings in...Read more
The presentation of these non-GAAP...Read more
The increase in revenue resulted...Read more
These effects were funded in...Read more
Failure to comply with any...Read more
This ASU will be applied...Read more
This new standard was adopted...Read more
This new standard was adopted...Read more
The new standard is effective...Read more
BSI Segment revenue increased by...Read more
BEST Segment revenue increased by...Read more
BSI Segment Revenue BSI Segment...Read more
BSI Segment revenue increased by...Read more
BSI Segment Revenue BSI Segment...Read more
Contract liabilities consist of customer...Read more
We can experience quarter-to-quarter fluctuations...Read more
System revenue and aftermarket revenue...Read more
Borrowings under the revolving credit...Read more
Interest and Other Income (Expense),...Read more
Interest and Other Income (Expense),...Read more
For the first nine months...Read more
For the first nine months...Read more
Excluding these effects, organic revenue,...Read more
Excluding these effects, organic revenue,...Read more
Revenues increased on an organic...Read more
Specifically, management believes that free...Read more
These measures may also be...Read more
Revenue for the three month...Read more
Revenue for the nine month...Read more
For contracts that include multiple...Read more
We use these non-GAAP financial...Read more
We intend to fund any...Read more
In the future, there are...Read more
The primary drivers of growth...Read more
During the nine months ended...Read more
Certain factors that might cause...Read more
Excluding the effects of foreign...Read more
Excluding the effects of foreign...Read more
Excluding the effects of foreign...Read more
Excluding the effects of foreign...Read more
Application of the cost-to-cost method...Read more
The following discussion of our...Read more
From a geographic perspective, revenues...Read more
The increase in our third...Read more
The increase in our effective...Read more
Operating Income The following table...Read more
Operating Income The following table...Read more
The income tax provision for...Read more
The income tax provision for...Read more
Financial Statements, Disclosures and Schedules
Inside this 10-Q Quarterly Report
Material Contracts, Statements, Certifications & more
Bruker Corp provided additional information to their SEC Filing as exhibits
Ticker: BRKR
CIK: 1109354
Form Type: 10-Q Quarterly Report
Accession Number: 0001104659-18-067274
Submitted to the SEC: Fri Nov 09 2018 6:59:43 AM EST
Accepted by the SEC: Fri Nov 09 2018
Period: Sunday, September 30, 2018
Industry: Laboratory Analytical Instruments

